
Figure 5.
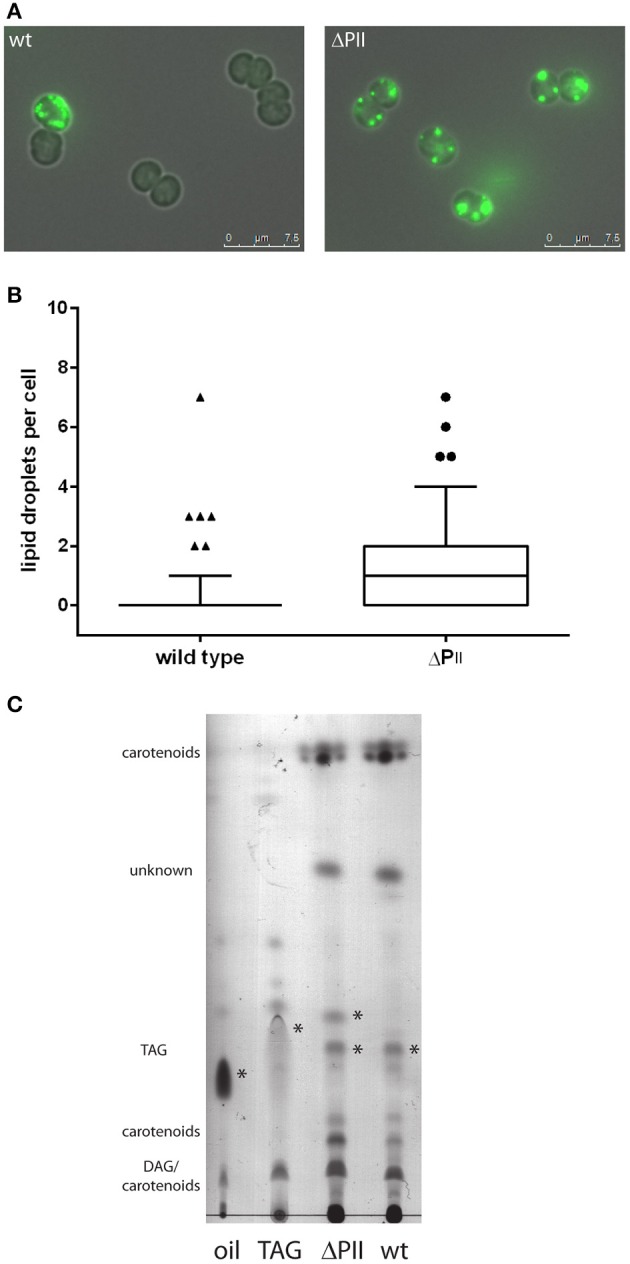
(A) Microscopic image of wild type and PII mutant stained with Bodipy 493/503 during exponential growth. Images are the superimposition of the fluorescence and bright field image. (B) Occurrence of lipid droplets per cell in the wild type (mean: 0.39 ± 0.12) and PII mutant (mean: 1.65 ± 0.23) at an OD750 of 0.2. The box plot displays the 10–90 percentile. The result is statistically significant with a p-value smaller than 0.0001 determined by an unpaired two tailed t-test. (C) Thin layer chromatography of hydrophobic lipids. Possible triacylglycerols are marked with asterisk. DAG: diacylglycerol TAG: triacylglycerol.