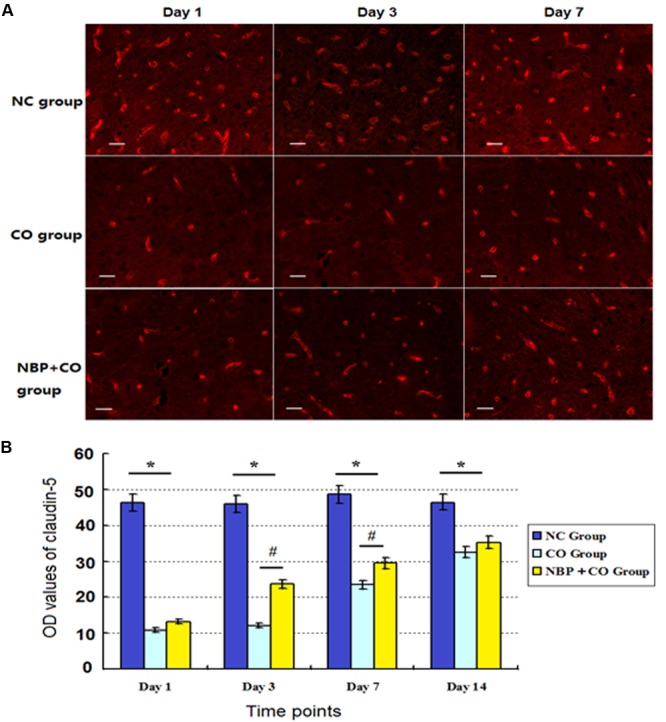
FIGURE 6.

Changes of claudin-5 expression in NC, CO and NBP+CO groups. A large number of claudin-5-positive vessels were observed in NC subjects, and the positive levels of claudin-5 protein were notably reduced on day 1, followed by gradually restoration to approximate normal level on day 14 in CO group. The levels of claudin-5-positive vessel in NBP+CO group were higher than that in CO group (n = 4, P < 0.05). (A) The expressions of claudin-5 positive cells in each group; (B) The OD value alterations of claudin-5 positive cells in different groups (n = 4). ∗Compared with NC group, P < 0.05; #compared with CO group at the same time point, P < 0.05 (F = 18.251∼32.817). Scale bar = 30 μm.
