
FIGURE 9.
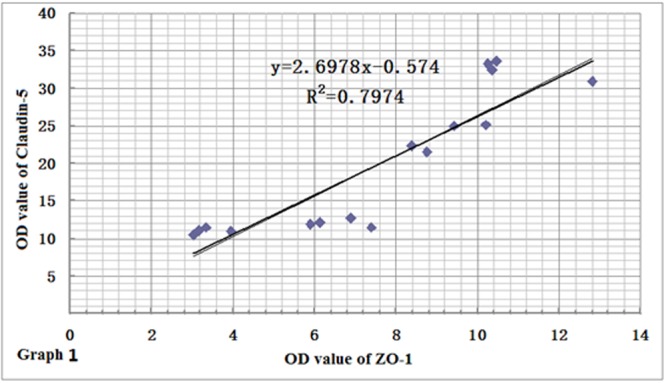
Relationship between ZO-1 and claudin-5 protein expressions. The variation of ZO-1 protein level was similar to that of claudin-5, and there existed positive correlation between the two proteins (r = 0.8930, n = 4).
Official websites use .gov
A
.gov website belongs to an official
government organization in the United States.
Secure .gov websites use HTTPS
A lock (
) or https:// means you've safely
connected to the .gov website. Share sensitive
information only on official, secure websites.
Relationship between ZO-1 and claudin-5 protein expressions. The variation of ZO-1 protein level was similar to that of claudin-5, and there existed positive correlation between the two proteins (r = 0.8930, n = 4).