
Figure 9.
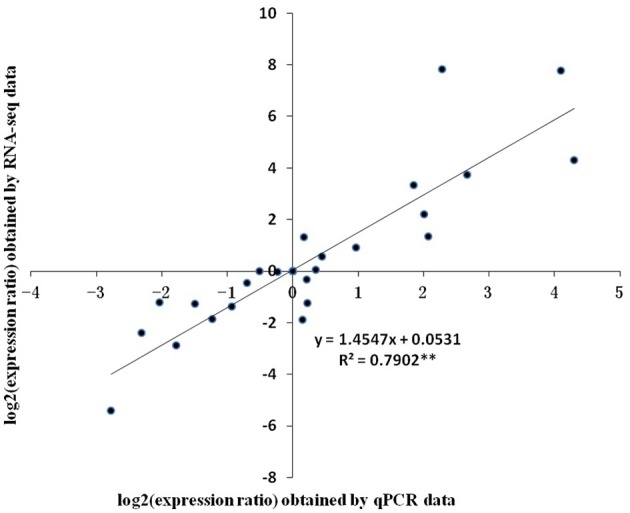
Correlation of relative gene expression levels obtained from RNA-Seq and from qPCR. The expression ratio was the ratio of gene expression level at one stage against the one at previous stage. Vertical bars represent standard errors of means (n = 3).