FIG 4 .
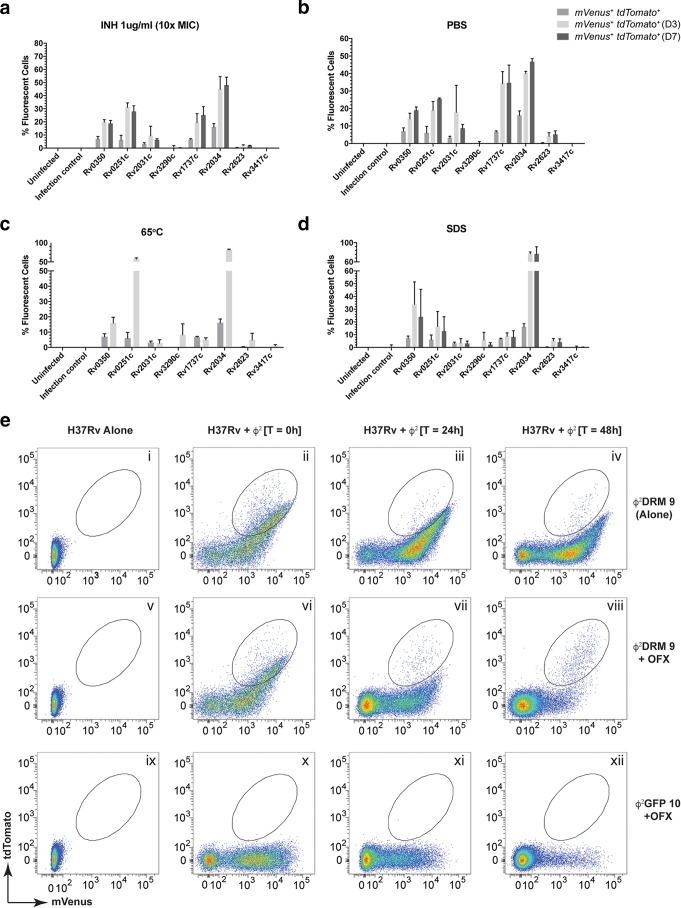
Activation of persister upregulated gene promoters in M. tuberculosis cells under stress. (a to d) The stress conditions used were INH (a), starvation (b), high temperature (c), and SDS (d). Gene promoters controlling tdTomato are indicated on each x axis. The percentage of the population turning on a specific promoter is plotted on each y axis. Error bars represent SEM from 3 independent experiments. For full gene names, see the legend to Fig. 3b. (e) Use of flow cytometry to monitor enrichment of a specific M. tuberculosis population after ofloxacin (OFX) treatment. Logarithmic-phase H37Rv was treated with OFX for 24 and 48 h and infected with either Φ2DRM9 (i to viii) or Φ2GFP10 (ix to xii). Cell-only controls (uninfected H37Rv) are shown in panels i, v, and ix. At time t0, a majority of the infected cells fluoresced green (ii, vi, and x). After 24 h of OFX treatment, the relative percentages of the fluorescent populations are reduced in the treated samples (compare panel vi to vii and x to xi). The same trend continued and the fluorescent populations were further reduced in the treated samples at 48 h (compare panel vi to viii and x to xii). At the end of 48 h, an mVenus+ tdTomato+ subpopulation (high tdTomato, low to medium mVenus) survives the treatment (circled, panel viii) and is the only fluorescent population remaining (compare panel iv to viii). The fluorescent population did not decrease in the untreated control cells (compare panels ii, iii, and iv).

