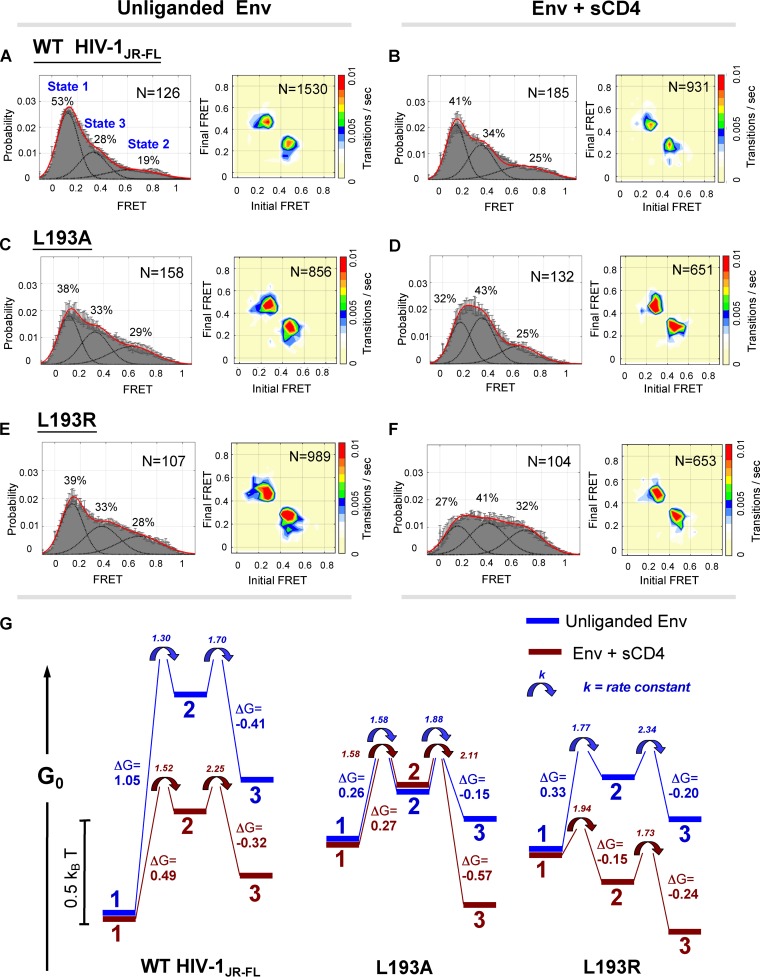
FIG 2 .
Single-molecule FRET analysis of the WT and leucine 193 HIV-1 Env variants. (A to F) Single-molecule fluorescence resonance energy transfer (smFRET) probes were placed in the gp120 V1 and V4 loops of WT or L193 mutant HIV-1JR-FL Envs. FRET trajectories were compiled into population FRET histograms and fitted to the Gaussian distributions associated with each conformational state, according to a hidden Markov model (43). The percentages of the population that occupied each state and the numbers of molecules analyzed are shown and represent averages of results of two independent experiments. Transition density plots (TDPs) are shown on the right. Note that the densities for the transitions between state 1 and state 2 and between state 2 and state 3 were readily detectable in the TDPs, whereas the densities for the transitions between state 1 and state 3 were not evident. This suggests that transitions between state 1 and state 3 occur through state 2. The results for the unliganded Envs (A, C, and E) and after incubation of the Envs with D1D2 sCD4 (B, D, and F) are shown. (G) The relative free energies of states 1, 2, and 3 for the unliganded (blue) and sCD4-bound (red) Envs. The placement of the energy diagrams for each Env variant on the absolute G0 scale is arbitrary. Note the similarity in the energy landscape of the unliganded L193 Env and the sCD4-bound WT Env proteins. The forward rate constants (1/s) are indicated adjacent to the arrows at each transition point.

