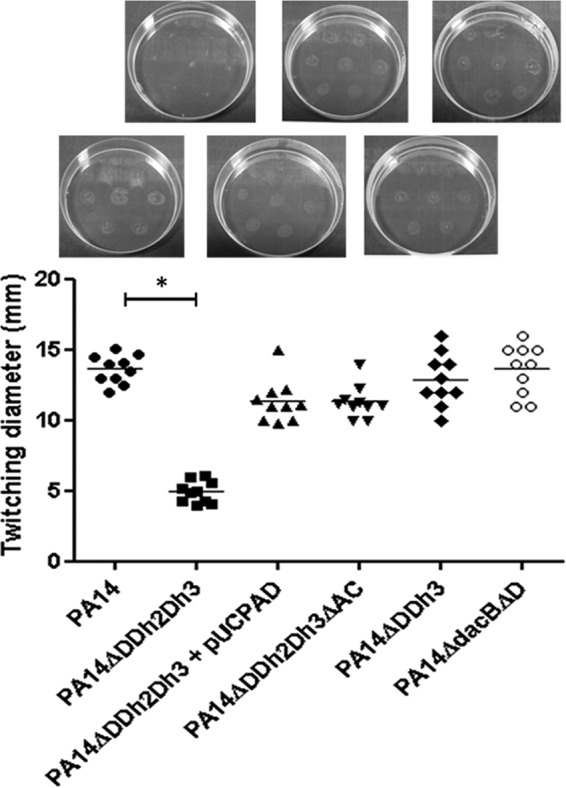
FIG 2 .

Twitching motility of strain PA14 and derived mutants. Colonies were inoculated as described in Materials and Methods. The diameters of the motility areas of 10 different colonies per strain were measured and plotted. Each symbol represents the value for one colony. Mean values for the 10 colonies are indicated by the short black bars for the strains. The values (means) that are significantly different (P < 0.0001 by Student’s t test) from the mean value for the wild-type strain are shown by a bar and asterisk. The rest of the single and double ampD mutants of strain PA14 showed wild-type twitching motility levels (not shown). The pictures above the graph show representative images of the corresponding strains.
