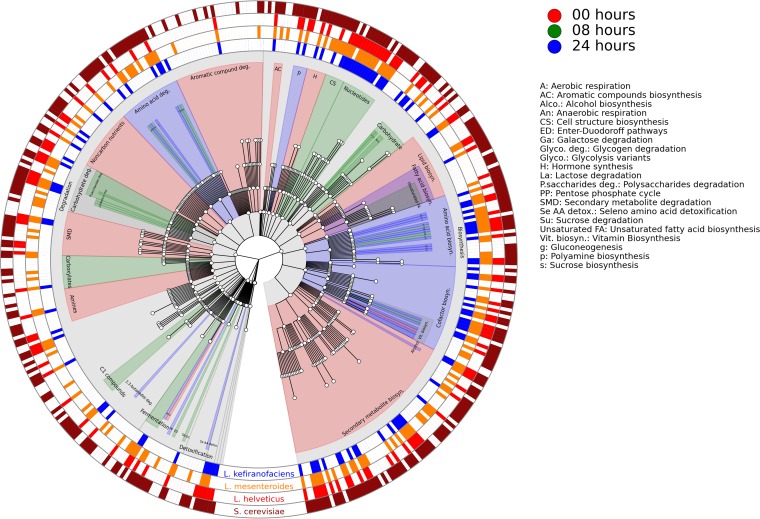
FIG 2 .
Cladogram presenting a hierarchical overview of the MetaCyc pathways detected in the kefir microbiome with HUMAnN2. Central nodes represent general pathway category functions, like carbohydrate catabolism, and their descendant nodes represent more specific pathway category functions, like sucrose degradation. The colors of the clades indicate the times at which pathways of particular interest were most prevalent, as determined by LEfSe. The outer rings indicate the presence/absence of pathways in L. kefiranofaciens (blue), L. mesenteroides (orange), L. helveticus (red), and S. cerevisiae (maroon).

