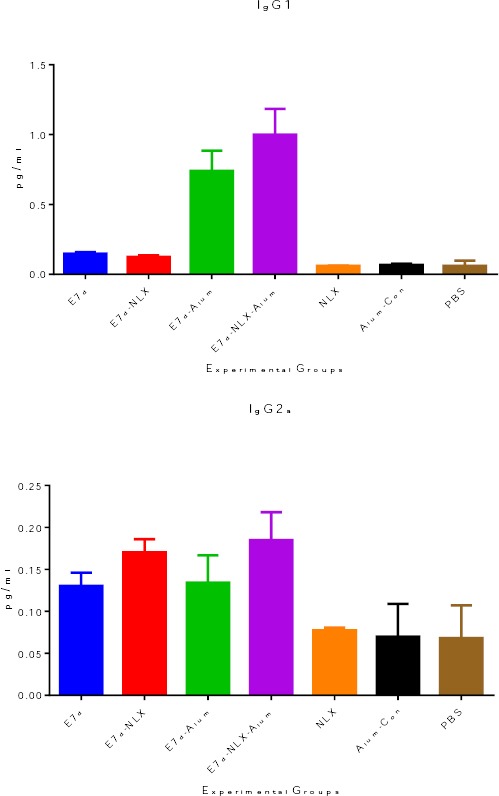
Figure 4.

Detection of IgG1 (a) and IgG2a (b) specific antibodies. The measurements were made with sera of experimental mice, and the values represent the means of optical density ± SD. Analysis of IgG1 and IgG2a isotypes have been represented in two distinct graphs. Each mouse sera was evaluated in duplicate by indirect ELISA using anti-IgG1 and anti-IgG2a antibodies and conjugated secondary antibody (HRP). Unlike other immunized groups, the titer of anti E7d-NLX-Alum IgG1 and IgG2a isotypes increased in comparison to other groups. Asterisks represent the groups which were statistically significant and ND indicates not detectable differences (P < 0.05). Error bars represent SD
