
Figure 2.
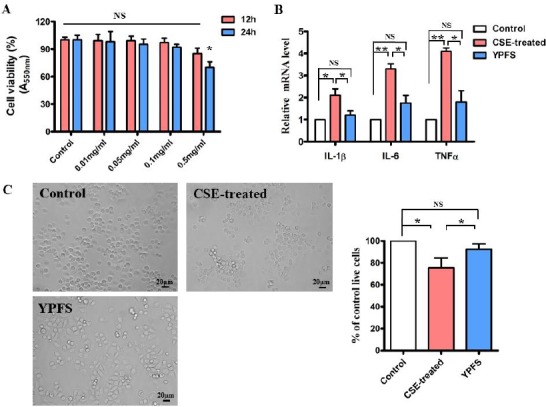
YPFS inhibited inflammatory cytokine releasing in CSE-treated Beas-2B cells. (A) The effect of YPFS on cell viability at the concentration of 0.01 mg/ml-0.5 mg/ml in human bronchial epithelial cells Beas-2B for 12 hr and 24 hr. Cell viability was performed with MTT assay. *P<0.05 NS, not significantly, versus control (normal saline). (B) After Beas-2B cells were exposed into RPMI-1640 medium with CSE for 24 hr, then 0.1 mg/ml YPFS was administrated for 24 hr, Quantitative PCR analysis was used to study the mRNA levels of IL-1β, IL-6 and TNFα. Data are expressed as mean±SEM of three independent experiments. *P<0.05 **P<0.01 NS, not significantly versus control. (C) Phase-contrast images of the CSE-treated Beas-2B cells were administrated with 0.1 mg/ml YPFS or normal saline for 24 hr, magnification x100. The right panel shows cell viability was determined using MTT assay. Data are expressed as mean±SEM of three independent experiments. *P< 0.05 NS, not significantly versus control