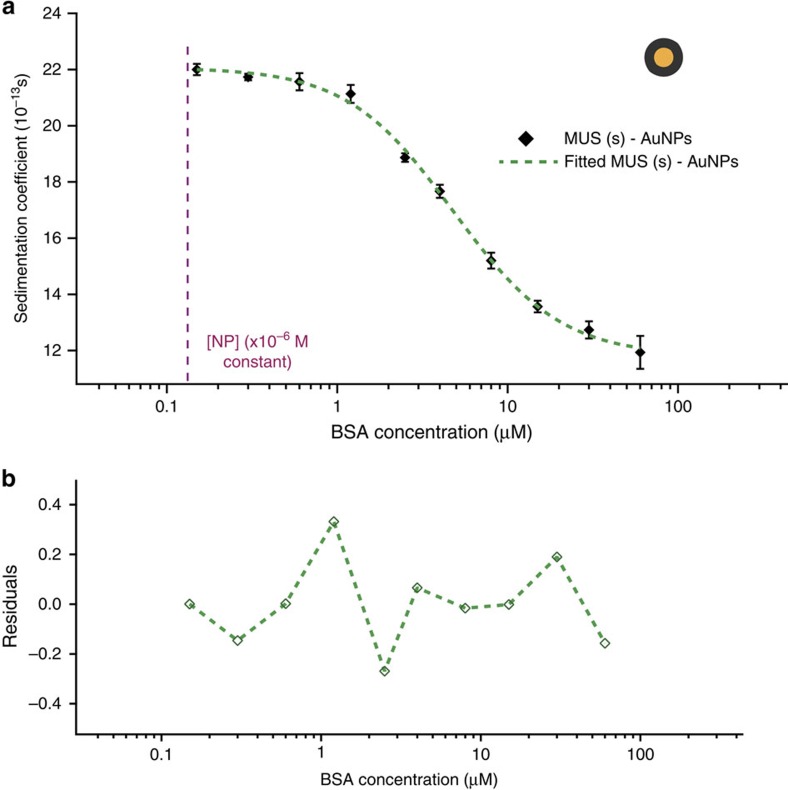
Figure 3. SV-AUC binding isotherm for very small AuNPs.
(a) Plot of average s versus BSA concentration for MUS(s)–AuNPs (dH=5.6 nm). Error bars represent the standard deviation of three independent measurements from the same batch of NPs. (b) Residuals plot of the fit function of MUS(s)–AuNPs–BSA isotherm. Dashed magenta line indicates the nanoparticle concentration kept constant during experiments.

