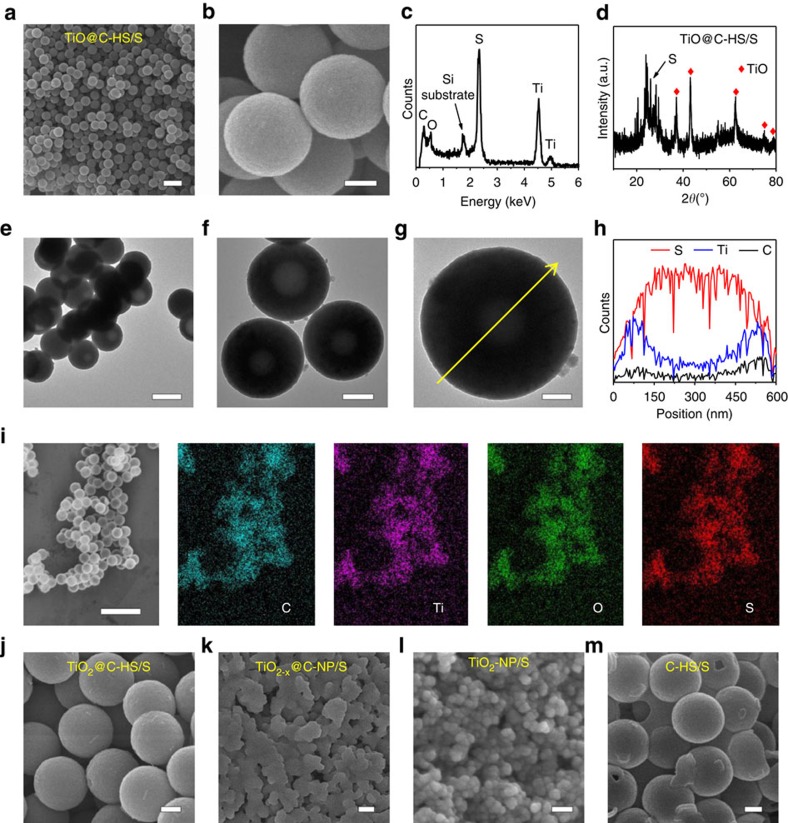
Figure 4. Characterization of the sulfur-based composite materials.
(a,b) SEM image, (c) EDX spectrum, (d) X-ray diffraction pattern, (e–g) TEM images, (h) linear distributions of S, Ti and C along the arrow line on g, and (i) EDX mapping area and corresponding elemental distributions of C, Ti, O and S of TiO@C-HS/S. SEM images of (j) TiO2@C-HS/S, (k) TiO2−x@C-NP/S, (l) TiO2-NP/S and (m) C-HS/S. Scale bars, 1 μm (a), scale bars, 200 nm (b,f,j,k,m), scale bars, 500 nm (e), scale bars, 100 nm (g,l), scale bars, 2 μm (i).

