Figure 1.
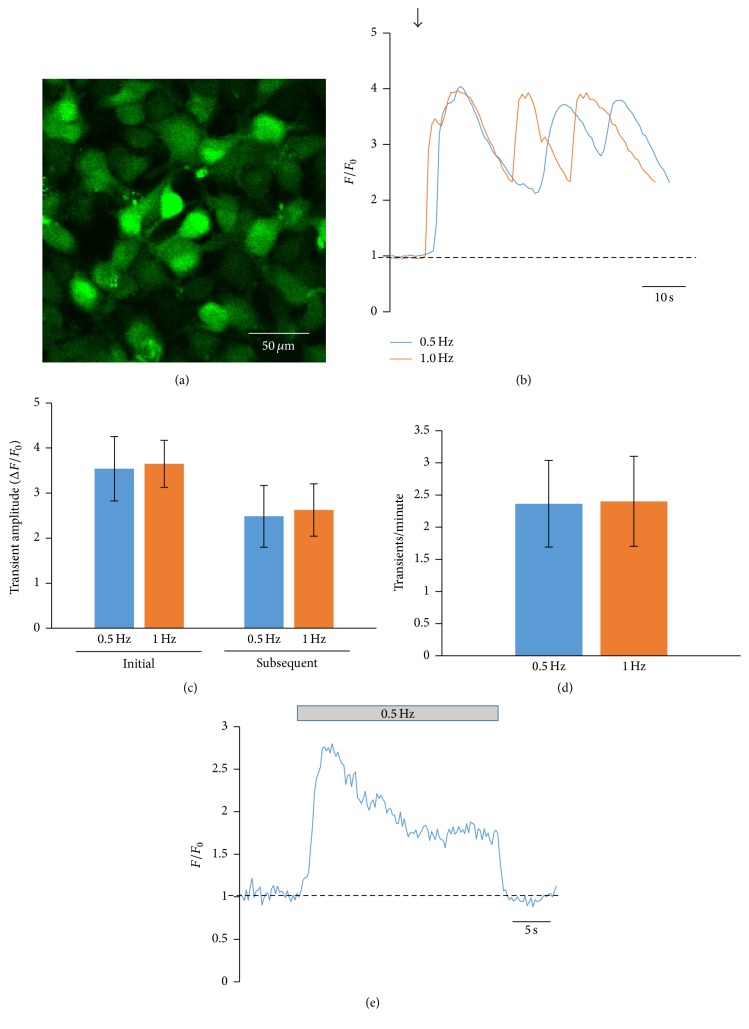
Whole-cell Ca2+ oscillations in electrically stimulated CPCs. (a) 2D fluorescent image of child CPCs loaded with fluo-4/AM. Fluo-4/AM-loaded hcCPCs were electrically stimulated at 0.5 Hz (blue) or 1 Hz (orange). Representative recordings of Ca2+ oscillations are shown in (b). The arrow indicates the start of electrical stimulation. The amplitude (ΔF/F 0) and frequency (oscillations/minute) of the oscillations are summarized in (c) and (d), respectively. (e) Representative recording of cytosolic Ca2+ before, during, and after 0.5 Hz electrical stimulation. The bar above the trace shows the time during the recording when electrical stimulation was applied. Data in (e) represent mean ± SD. No significance was found by Student's t-test. n = 14 cells from 4 different pools of cells for all measurements.

