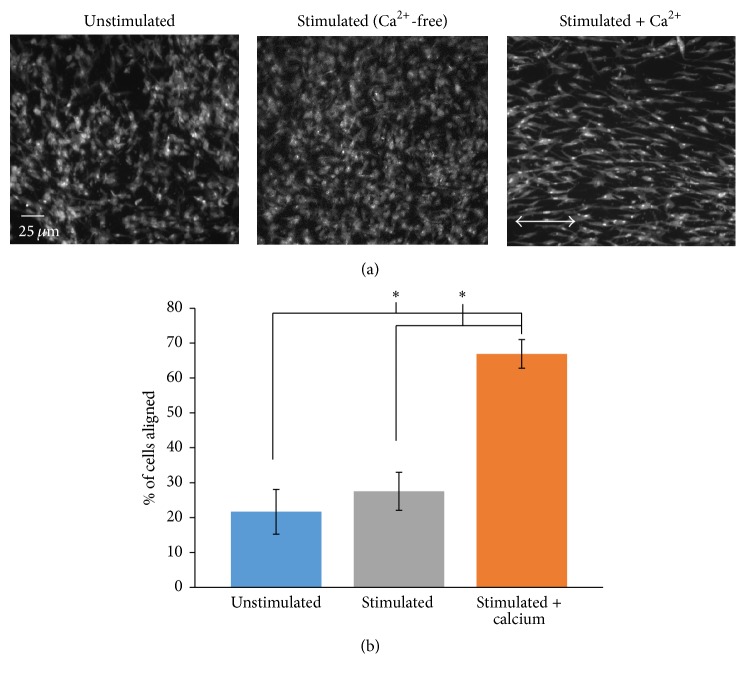
Figure 6.
Electrically induced alignment of CPCs. CPCs were plated in stimulation media and subjected to electrical stimulation in culture for 72 hrs (stimulated + Ca2+). As controls, CPCs were plated in stimulation media and cultured for 72 hrs without electrical stimulation (unstimulated) or in Ca2+-free media and subjected to electrical stimulation (stimulated). All groups were fixed, permeabilized, and incubated with fluorescein-5-maleimide. Representative images of cells from the three groups are shown in (a). Summary bar graph of cellular alignment for the three culture conditions is shown in (b). Arrow in (a) (stimulated + Ca2+) is the direction of the electrical field. Data in (b) represent mean ± SD. ∗ p < 0.05; Student's t-test; n = 8 replicates.

