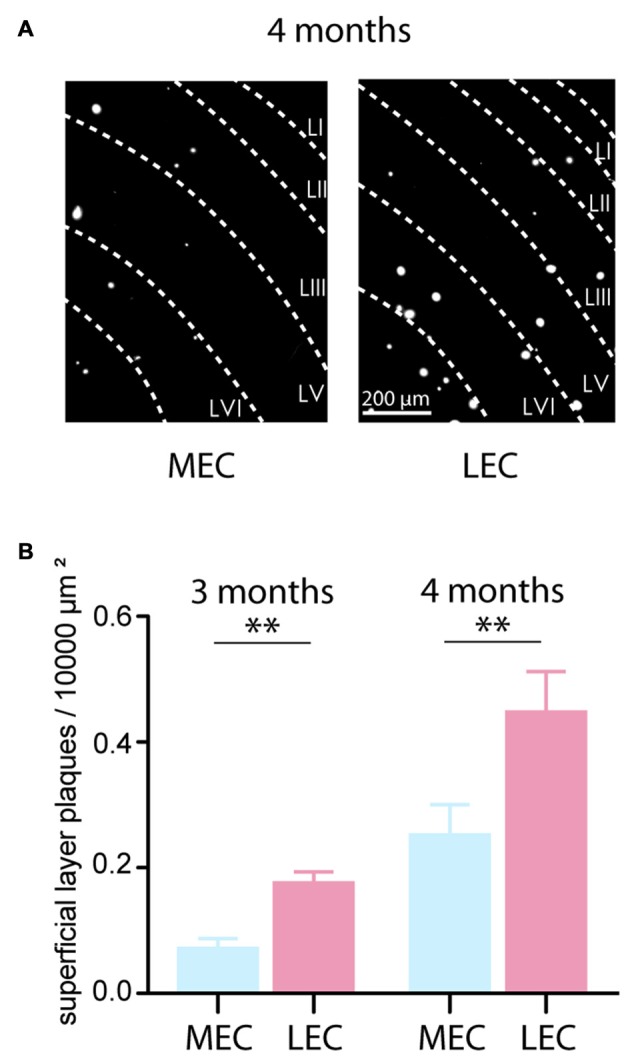
Figure 3.

Plaque load in the LEC leads the MEC. (A) Aβ plaques were visualized in the MEC and LEC by Methoxy-X04 staining procedure. Plaques in the superficial layers II and III were quantified. The example shows plaque load from 4 months old tg APP-PS1 mice from the dorsal MEC and LEC. (B) Left: At 3 months already, the LEC had a significantly greater plaque density in the superficial layers suggesting that LEC rather than the MEC is the starting point of plaque deposition in the entorhinal cortex in the tg APP-PS1 mice (MEC plaque load: 0.07 ± 0.02 plaques per 10,000 μm2, LEC plaque load: 0.18 ± 0.02 plaques per 10,000 μm2, n = 28 slices, N = 2 tg animals; p < 0.0001). Right: LEC and MEC plaque density at 4 months old tg APP-PS1 mice (MEC plaque load: 0.25 ± 0.05 plaques per 10,000 μm2, LEC plaque load: 0.45 ± 0.06 plaques per 10,000 μm2, n = 24 slices, N = 3 tg animals; p = 0.0058). n.s.–non significant, *p < 0.05, **p < 0.01.
