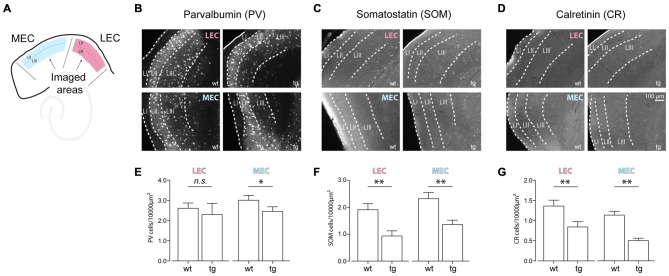
Figure 4.
Early changes in the density of cortical interneurons in the entorhinal cortices in the tg APP-PS1 mice. (A) Cartoon showing the imaged areas in the MEC and LEC. (B–D) Top panel shows dorsal LEC wt and tg and bottom panel shows dorsal MEC wt and tg for (B) Parvalbumin (PV; C) Somatostatin (SOM) and (D) Calretinin (CR) positive interneurons. (E–G) Quantification of the density of the three classes of cortical interneurons showed a larger decrease for the (F) SOM and (G) CR positive (SOM LEC—wt: 1.91 ± 0.22 cells per 10,000 μm2 vs. tg: 0.93 ± 0.19 cells per 10,000 μm2, n = 24 LEC wt, 18 LEC tg slices; p = 0.0005; SOM MEC—wt: 2.32 ± 0.23 cells per 10,000 μm2 vs. tg: 1.36 ± 0.16 cells per 10,000 μm2, n = 23 MEC wt, 22 MEC tg slices; p = 0.0006. CR LEC—wt: 1.36 ± 0.15 cells per 10,000 μm2 vs. tg: 0.84 ± 0.13 cells per 10,000 μm2, n = 24 LEC wt, 21 LEC tg slices; p = 0.0052; CR MEC—wt: 1.14 ± 0.09 cells per 10,000 μm2 vs. tg: 0.50 ± 0.06 cells per 10,000 μm2, n = 25 MEC wt, 19 MEC tg slices; p < 0.0001) interneurons as compared to the (E) PV (PV LEC—wt: 2.61 ± 0.26 cells per 10,000 μm2 vs. tg: 2.30 ± 0.55 cells per 10,000 μm2, n = 23 LEC wt, 18 LEC tg slices; p = 0.0531; PV MEC—wt: 3.01 ± 0.23 cells per 10,000 μm2 vs. tg: 2.46 ± 0.23 cells per 10,000 μm2, n = 22 MEC wt, 18 MEC tg slices; p = 0.0500) positive interneurons at 4–5 months of age in the tg APP-PS1 mice. n.s.–non significant, *p < 0.05, **p < 0.01.

