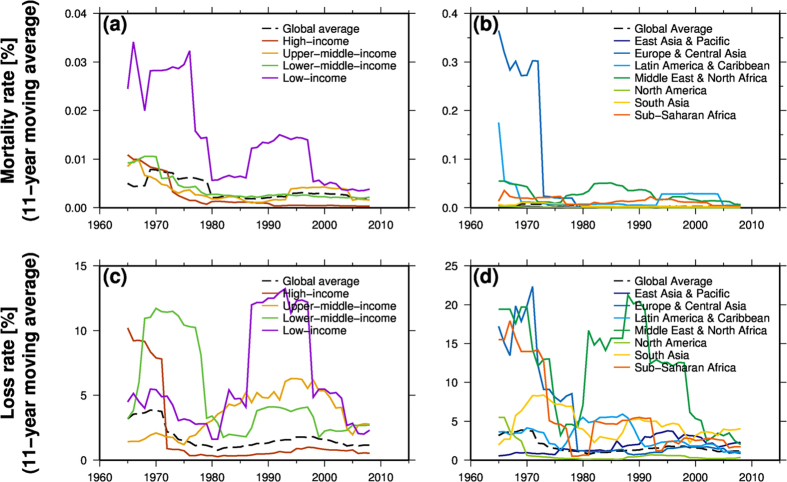
Figure 2.
Mortality rate (a,b) and loss rate (c,d) at each income level (a,c) and each region (b,d). An 11-year moving average is shown. The present-day (base year 2014) income level for each country and regional division were derived from the World Bank. This figure was created using Generic Mapping Tools 4.5.6.

