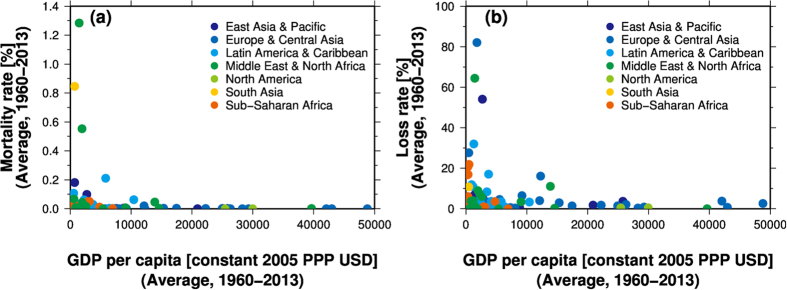
Figure 3.
(a) Relationship between gross domestic product (GDP) per capita (USD at purchasing power parity [PPP] in 2005) and mortality rate. (b) Same as (a) but for loss rate. GDP per capita was derived from James et al.41. The present-day regional divisions were derived from the World Bank. This figure was created using Generic Mapping Tools 4.5.6.

