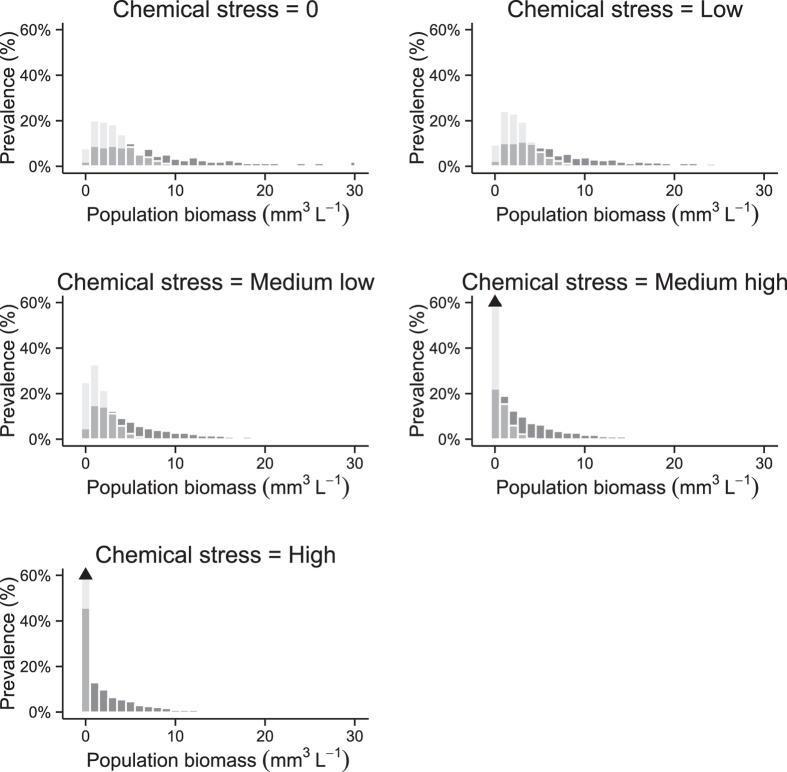
Figure 2. Raw prevalence histogram.
Prevalence distribution of the population biomass (mm3 L−1) for the Temperate (dark grey) and the Tropical (light grey) conceptual scenarios for the five ranges of chemical stress level. The arrows in the “Medium high” and “High” panels denote a prevalence of 76% and 100% respectively.

