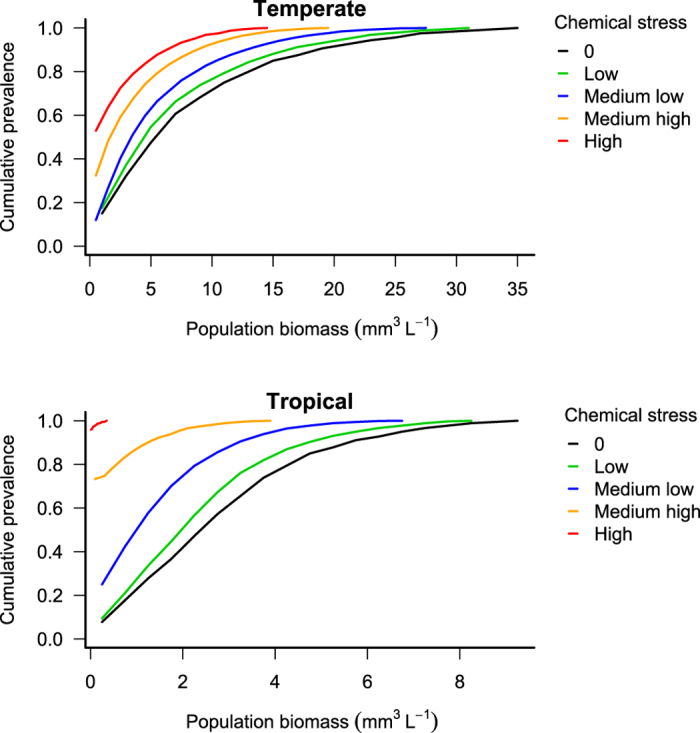
Figure 3. Raw prevalence plot.

Population biomass (mm3 L−1) for the Temperate and Tropical scenarios as a function of the cumulative prevalence for the five ranges of chemical stress.

Population biomass (mm3 L−1) for the Temperate and Tropical scenarios as a function of the cumulative prevalence for the five ranges of chemical stress.