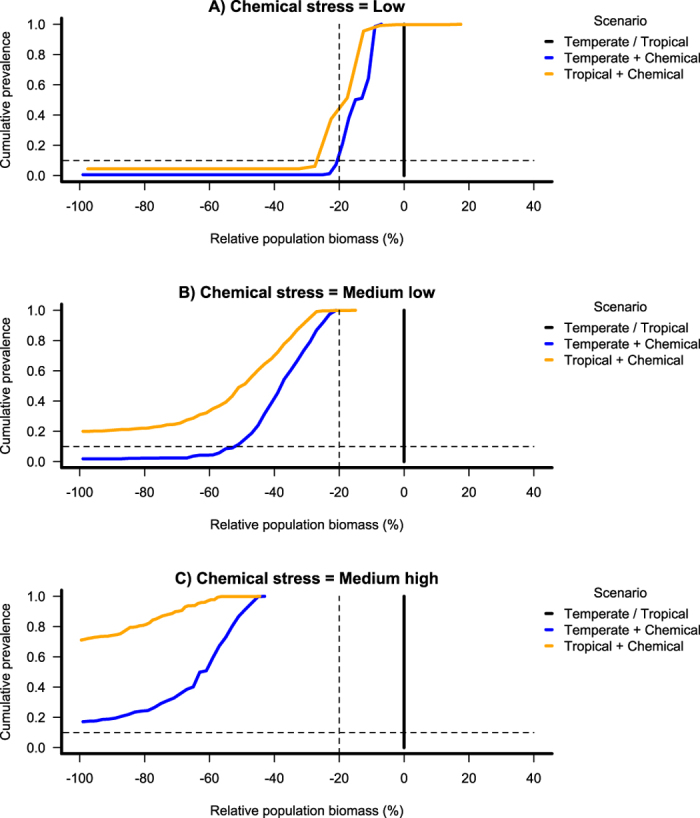
Figure 4. Effect-size prevalence plot.

Population biomass relative to the no-chemical stress level population biomass (baseline) as a function of the cumulative prevalence for the baseline state, the Temperate and the Tropical scenarios and for a low, medium low, and medium high level of chemical stress.
