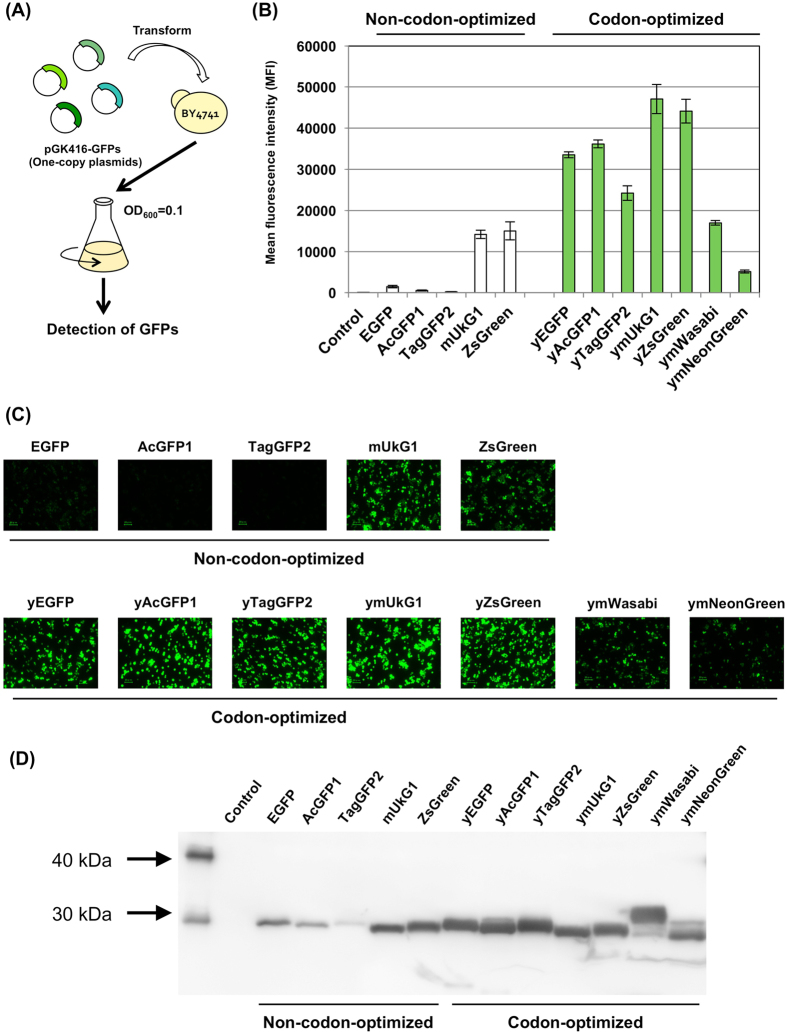
Figure 1. GFP expression in S. cerevisiae.
(A) Flow diagram of GFP detection assays. GFP expression plasmids were transformed into the BY4741 yeast strain; the cells were then grown, and GFP expression was analyzed. (B) Mean GFP fluorescence intensities (MFIs). The MFIs of 10,000 cells were measured by flow cytometry. (C) Green fluorescence images of the cells. The images were acquired with a fluorescence microscope equipped with a 60× objective lens. Scale bar: 20 μm. The exposure time was 1/15 s. (D) Western blot analysis. Western blot analysis was performed using as the primary antibody monoclonal anti-frag M2 antibody for the GFPs fused frag tag. Alkaline phosphatase-conjugated anti-mouse IgG was used as the secondary antibody, and colorimetric detection of alkaline phosphatase activity was performed using CDP-Star detection reagent. ‘Control’ indicates the BY4741 yeast strain harboring a mock pGK416 plasmid.

