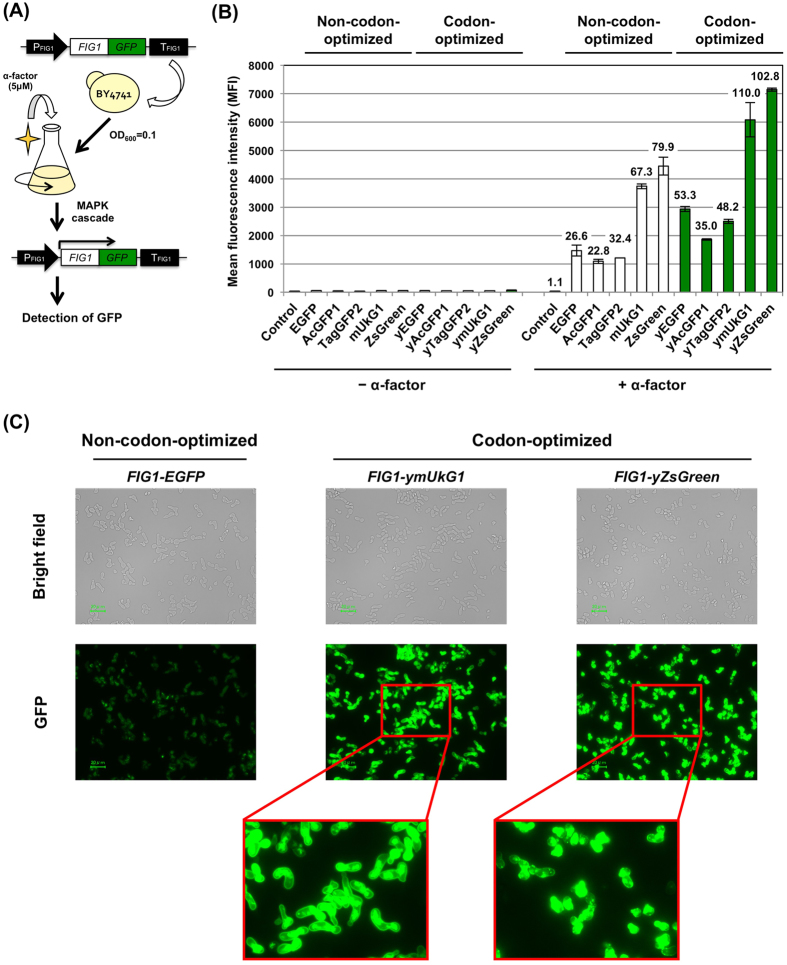
Figure 2. Expression of GFPs as fusion-tagged proteins to report the activation of signal transduction in S. cerevisiae.
(A) Flow diagram of GFP transcription assays used to detect signal transduction. FIG1-GFP fusion genes were substituted for the FIG1 gene in the yeast genome. The cells were grown in media with and without 5 μM α-factor, and GFP expression was measured. (B) Mean GFP fluorescence intensities (MFIs). The MFIs of 10,000 cells were measured by flow cytometry. (C) Green fluorescence images of the cells. The images were acquired with a fluorescence microscope equipped with a 60× objective lens. Scale bar: 20 μm. The exposure time was 1/4 s. Codon-optimized and non-codon-optimized GFPs were evaluated. ‘Control’ indicates the BY4741 wild-type yeast strain.

