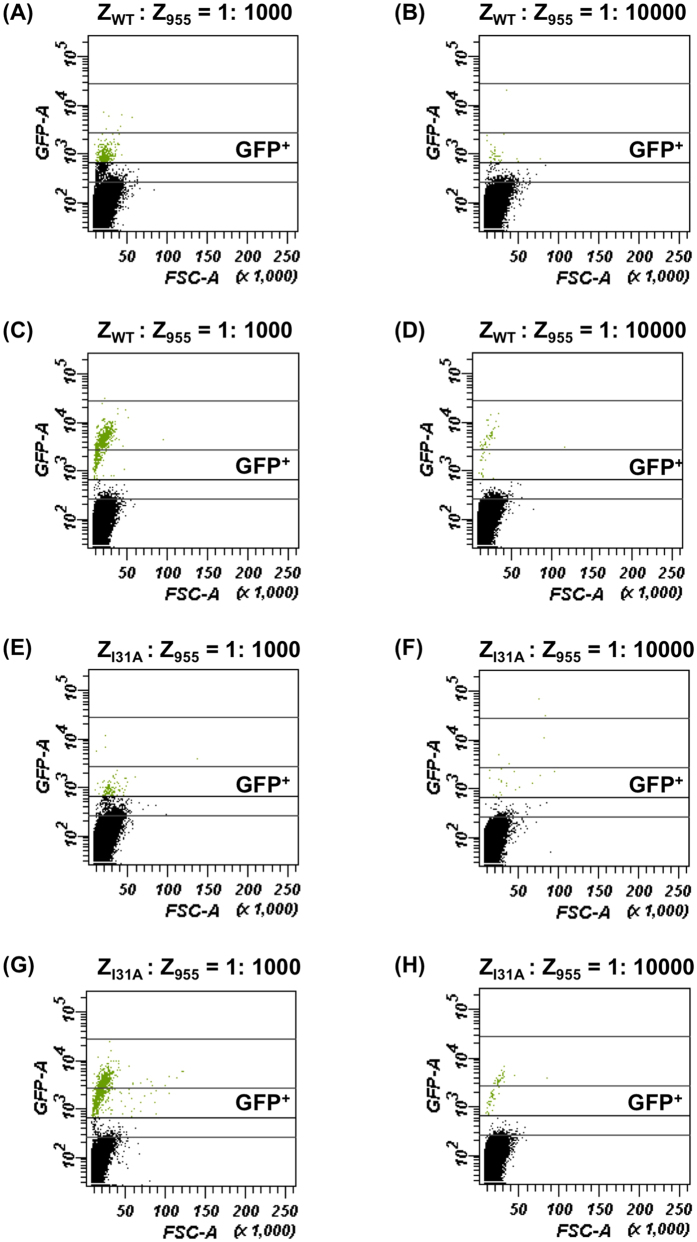
Figure 4. FACS detections of target cells in cell mixtures containing positive and negative cells.
Data were presented as dot plots (forward scatter, FSC-A vs green fluorescence, GFP-A). Y-axis is an indication of fluorescence and X-axis is an approximation of relative cell size. Cell mixtures were prepared by mixing positive cells (expressing membrane-anchored ZWT or ZI31A with Gγcyto-Fc) and negative cells (expressing membrane-anchored Z955 with Gγcyto-Fc) with two different mixing rates (0.1% and 0.01% positive cells). After cultivation of the cell mixtures in the presence of α-factor for 6 hours, 106 cells were analyzed using flow cytometer and the numbers of the positive (target) cells contained in the gate area (GFP+) were evaluated. (A,B) Cell mixtures containing 0.1% and 0.01% target cells expressing ZWT in BFG2118 yeast strain (EGFP reporter). (C,D) Cell mixtures containing 0.1% and 0.01% target cells expressing ZWT in UGFG2 yeast strain (ymUkG1 reporter). (E,F) Cell mixtures containing 0.1% and 0.01% target cells expressing ZI31A in BFG2118 yeast strain (EGFP reporter). (G,H) Cell mixtures containing 0.1% and 0.01% target cells expressing ZI31A in UGFG2 (ymUkG1 reporter).

