
Figure 1. STRUCTURE clustering (admixture) in which each isolate is represented by a single vertical line that is partitioned into K = 2 colored segments.
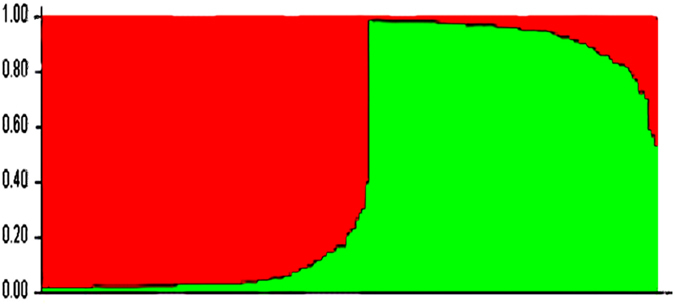
The segment length represents the individual’s estimated membership fractions in cluster 1 (red) and cluster 2 (green). Isolates with multiple colors have admixed genotypes from each cluster.