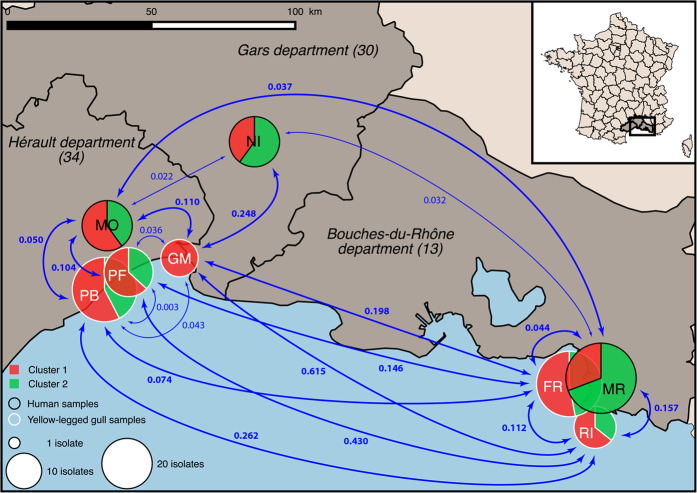
Figure 3. Map of the three cities, Montpellier, Nîmes and Marseille, and the yellow-legged gulls’ breeding colonies in the Mediterranean areas where isolates were sampled.
The nodes indicate the relative number of isolates sampled in the respective region. Pie chart colors correspond to the proportion of two genetic clusters of the 190 Candida glabrata isolates at each site. C. glabrata population differentiation between study sites was measured via calculation of pairwise FST. Statistically significant FST values are indicated in bold. The locations of the yellow-legged gulls’ breeding colonies are abbreviated as: PB = lagoon of Pierre Blanche; PF = Palavas-les-Flots; GM = La Grande-Motte; FR = Frioul Archipelago; and RI = Riou Archipelago). [This map was created on the open source QGIS Geographic Information System software version 2.12.1-Lyon (http://qgis.osgeo.org), using an open license shapefile of French departments obtained from IGN (http://professionnels.ign.fr/geofla)].

