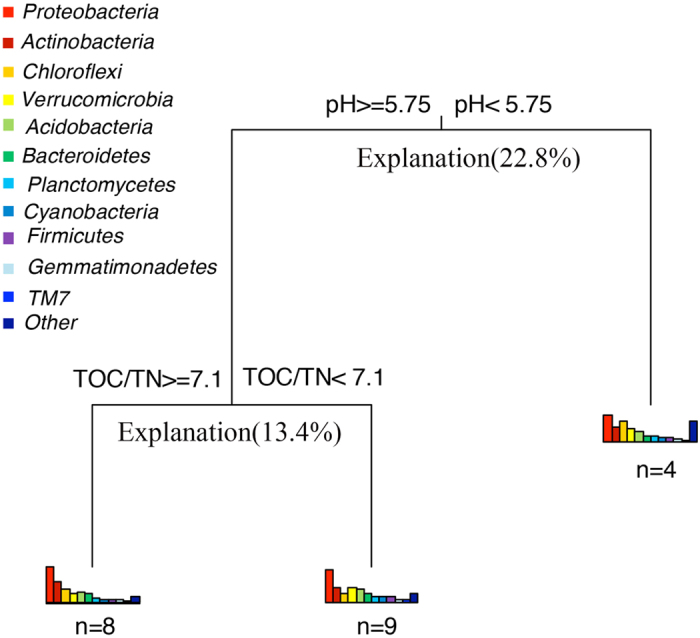
Figure 3. Multivariate regression tree (MRT) analysis of the relation between relative abundance of 11 dominant phyla and environmental factors.

Bars plotted under each cluster represent the relative abundance of each phylum. The distribution patterns of relative abundance represent the dynamics of community composition among each split. The numbers under the bars are the number of samples in each group.
