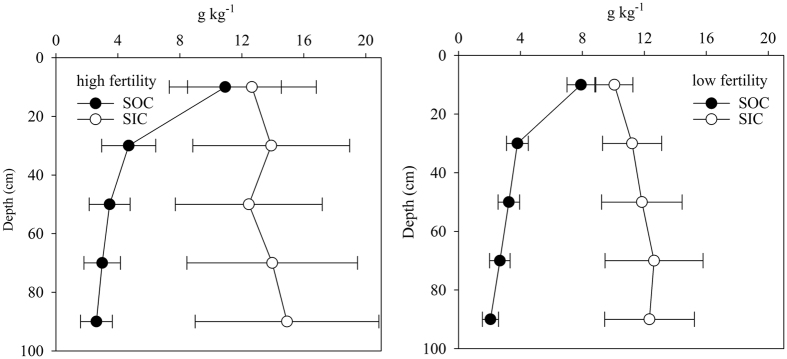
Figure 6. Vertical distributions of mean soil organic carbon (SOC) and inorganic carbon (SIC) for the high fertility (left) and low fertility(right) soils.
The error bars indicate standard deviation. Soil profiles with SOC ≥ 9 g kg−1 in the upper 20 cm were regarded as high fertility, and profiles with SOC < 9 g kg−1 were regarded as low fertility.

