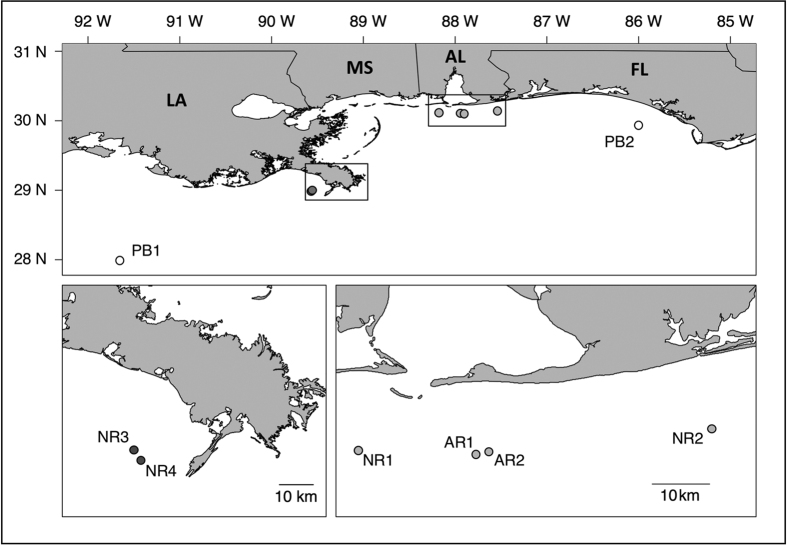
Figure 1. Map of red snapper (Lutjanus campechanus) sampling locations.
The two lower panels are insets of the top panel at smaller spatial scales. Adult samples are represented with white circles, young of the year (YOY) from Louisiana in dark grey circles, and YOY from Alabama in light grey. Maps were created using R version 3.2.2 (“R: A Language and Environment for Statistical Computing, R Core Team, R Foundation for Statistical Computing, Vienna, Austria (2016) https://www.R-project.org”).

