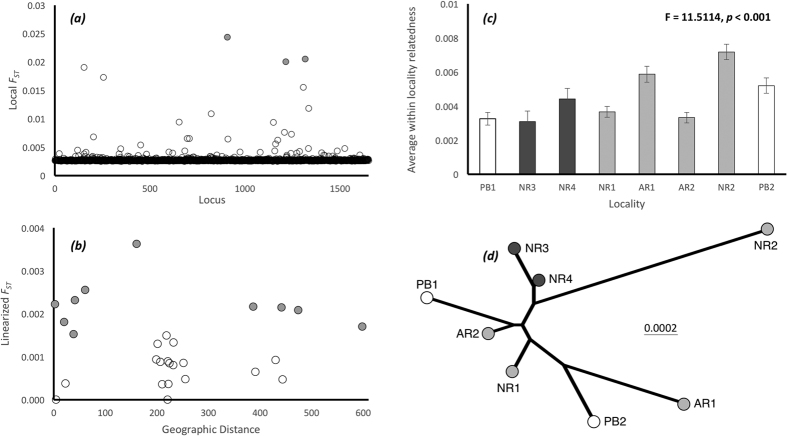
Figure 2. Results of genetic analyses.
(a) FST values generated during outlier detection. Three loci were not outliers (0.1 > q > 0.05), but were removed to ensure neutrality (shaded in grey). (b) Pairwise FST values (significant values are grey) plotted against geographic distance. (c) Average within-locality relatedness; (d) Neighbour-joining tree generated from pairwise estimates of Nei’s genetic distance. In (c,d) locality geography and sample type are differentiated by different shading: Adult samples have no shading; YOY samples near Louisiana are in dark grey, and YOY samples near Alabama are shaded in light grey.

