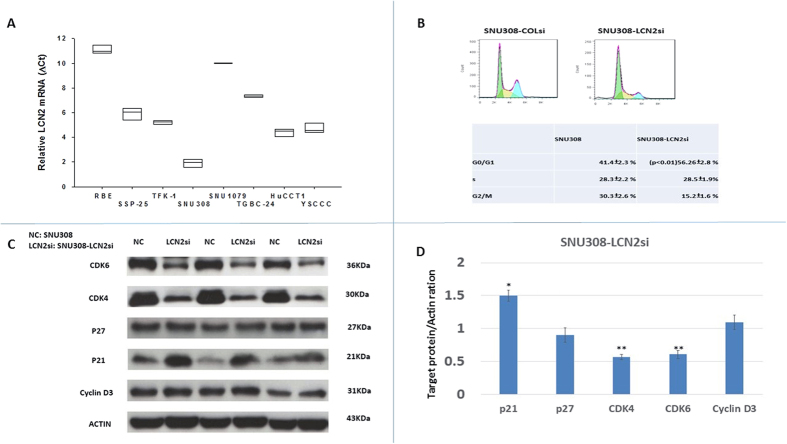
Figure 1. Expression of LCN2 mRNA in 8 kinds of CCA cells and LCN2 effect on SNU308 cell cycle distribution.
(A) LCN2 mRNA expressions were measured in 8 kinds of CCA cells with RBE and SNU308 cells had the lowest and highest LCN2 mRNA expressions, respectively. (B) Histogram of cell cycle distribution (upper panel) and quantitative result of cell cycle distribution (lower panel) of SNU308-COLsi and SNU308-LCN2si cells. (C) Western blots showing CDK4, CDK6, cyclin D3, p21, and p27 expression in SNU308-COLsi and SNU308-LCN2si cells. Experiments were done in triplicate and repeated at least three times. (D) Quantitative result of the western blot. Each value was a mean ± SD of three independent determinations. Data was presented as the intensity of protein bands of the target genes/β-actin relative to the control. Experiment was done at least three times (*P < 0.05).

