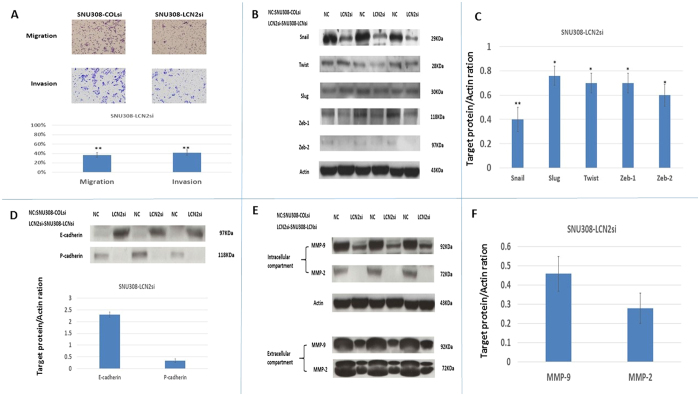
Figure 2. The effect of LCN2 knockdown on SNU308 cell metastasis.
(A) The migration and invasion ability of SNU308-COLsi and SNU308-LCN2si cells. Experiments were performed in triplicate and repeated at least three times. Data was presented as the ratio to the control (SU309-COLsi group) (**p < 0.01). (B) The western blot to show Snail, Slug, Twist, Zeb-1, and Zeb-2 expression in SNU308-COLsi and SNU308-LCN2si cells. (C) Quantitative result of the western blot shown in figure B. Each value was a mean ± SD of three independent determinations. Data was presented as the intensity of protein bands of the target genes/β-actin relative to the control. Experiment was done at least three times (*P < 0.05, **p < 0.01). (D) The western blot and quantitative analysis of E-cadherin and P-cadherin expression in SNU308-COLsi and SNU308-LCN2si cells. Each value was a mean ± SD of three independent determinations. Data was presented as the intensity of protein bands of the target genes/β-actin relative to the control. Experiment was done at least three times (**P < 0.01). (E) The western blot depicting intracellular and extracellular MMP-2 and MMP-9 expression in SNU308-COLsi and SNU308-LCN2si cells. (F) The quantitative analysis of the western blot shown in figure E. Each value was a mean ± SD of three independent determinations. Data was presented as the intensity of protein bands of the target genes/β-actin relative to the control. Experiment was done at least three times (**P < 0.01).

