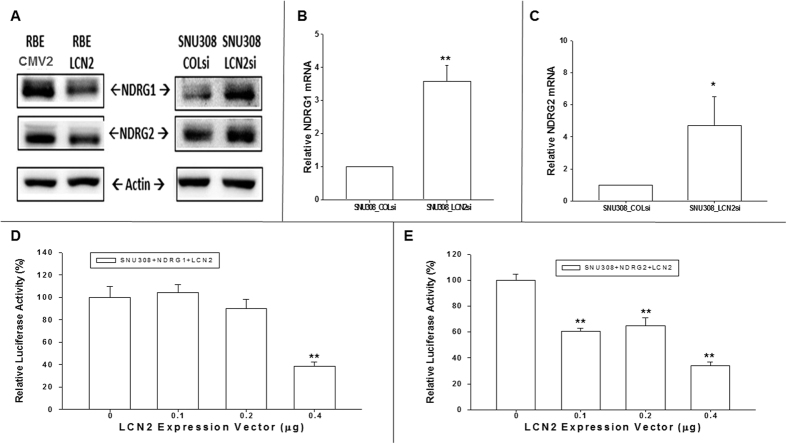
Figure 4. Evaluation LCN2 effect on NDRG1 and NDRG2 expressions in CCA cells.
(A) The western blot to show the downregulation or upregulation of NDRG1 and NDRG2 as LCN2 overexpression in RBE cells or knockdown in SNU308 cells. (B) Relative NDRG1 mRNA expression of SNU308-LCN2si cells to SNU308-COLsi cells. Each value was a mean ± SD of three independent determinations. Experiment was done at least three times (**P < 0.01). (C) Relative NDRG2 mRNA expression of SNU308-LCN2si cells to SNU308-COLsi cells. Each value was a mean ± SD of three independent determinations. Experiment was done at least three times (**P < 0.01). (D) The activity of NDRG1 reporter in SNU308 cells as treated with indicated concentrations of LCN2 expression vectors. Each value was a mean ± SD of three independent determinations. Experiment was done at least three times (**P < 0.01). (E) The activity of NDRG2 reporter in SNU308 cells as treated with indicated concentrations of LCN2 expression vectors. Each value was a mean ± SD of three independent determinations. Experiment was done at least three times (**P < 0.01).

