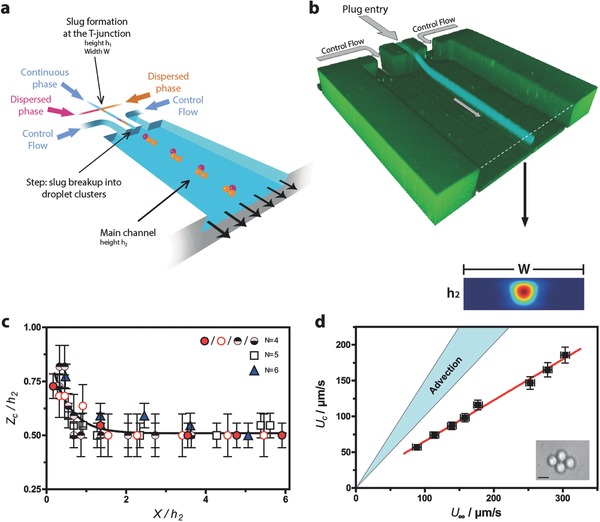
Figure 1.

Sketch of the device, flow structure, and droplet positioning in the self‐assembly channel. a) Schematic diagram of the two‐level microfluidic device. b) Confocal image of the system, taken over long exposure times and comparison with COMSOL simulations (Supporting Information), scale bar : 50 μm. c) Cluster position measurements using adaptive focus, for different cluster sizes. The cluster position along the “vertical” z‐axis (normal to the bottom wall), normalized by the main channel height h 2, is shown as a function of the streamwise distance x to the step normalized in the same manner. “N” is the number of droplets inside the cluster. All the experiments are performed in PDMS systems, with h 1 = 1 μm, h 2 = 10 μm, and d = 5 μm using fluorinated oil, water, and 2% SDS. Different symbols are used for N = 4, to indicate that different pressure conditions at the control flow entry have been used. d) Diamond speed U C as a function of the mean flow upstream speed U ∞, obtained by dividing the flow‐rate through the main channel by the cross‐sectionnal area. Full lines represent the passive advection hypothesis, in two limiting cases: U c = U ∞ (if the cluster obstructed the main channel) and (if the cluster was pointwise and located on the symmetry axis of the main channel). The PDMS system dimensions are h 1 = 1 μm, h 2 = 22 μm, w = 20 μm, and fluorinated oil in water was used with 2% SDS. Scale bar: 5 μm.
