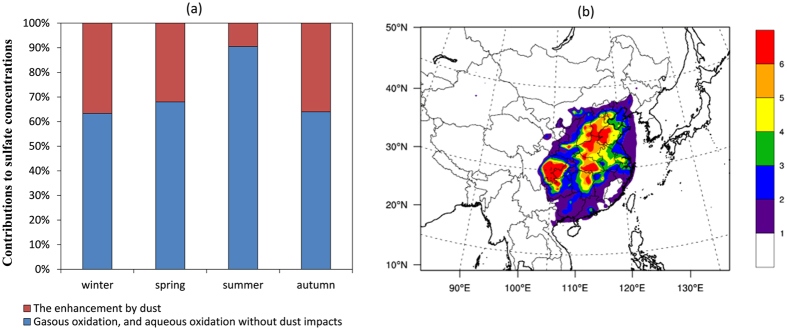
Figure 4.
(a) Seasonal contributions of different pathways to sulfate production in China; (b) Spatial distribution of the increased sulfate concentrations (μg/m3) caused by dust impacts. This figure is produced using the NCAR Command Language (Version 6.2.1) [Software]. (2014). Boulder, Colorado: UCAR/NCAR/CISL/TDD. http://dx.doi.org/10.5065/D6WD3XH5, and Microsoft office 2013 (https://www.microsoft.com/).

