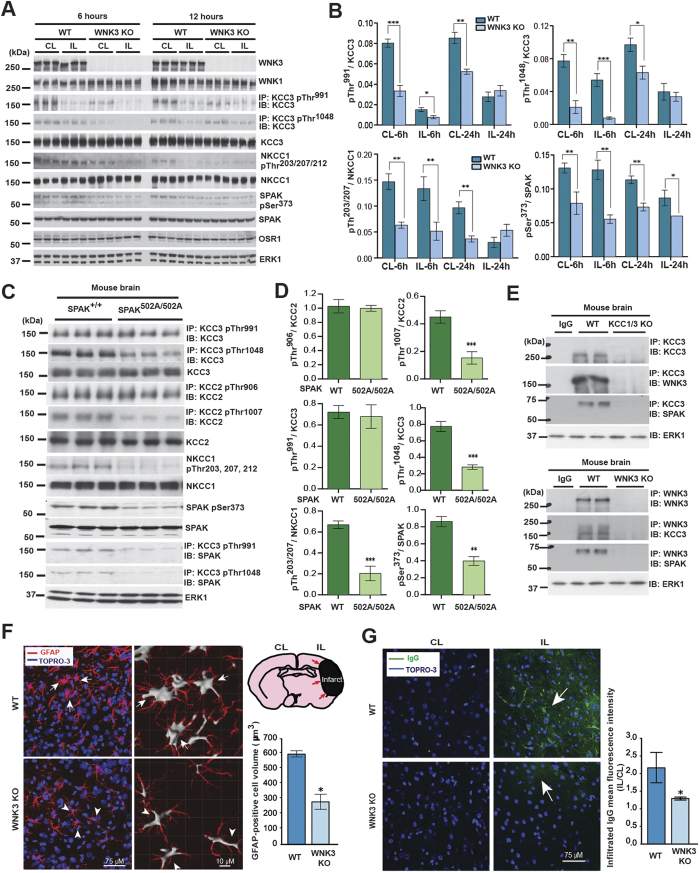
Figure 6. WNK3-SPAK inhibition attenuates the cytotoxic edema of astrocytes and endothelial cells of the blood-brain barrier by decreasing NKCC1/KCC3 phosphorylation.
(A) Effect of WNK3 knockout on NKCC1 and KCC3 expression and phosphorylation in vivo. WT WNK3 and WNK3 KO mice56 were subjected to transient middle cerebral artery occlusion (MCAO), a model of ischemic brain swelling44. Whole brain homogenates were subjected to immunoprecipitation (IP) and/or immunoblot (IB) with the indicated antibodies. Lysates were immunoblotted in parallel. Molecular masses (kDa) are indicated at the left. (B) Bar graphs present the ratio of the phosphorylated target signal to total target intensity (mean+/− SD). *p < 0.05; **p < 0.01; ***p < 0.001. CL: contralateral; IL: ipsilateral. WNK3 KO mice exhibit apparently decreased KCC3 P-Thr1048 and NKCC1 P-Thr203/Thr207/Thr212 signals. (C) Effect of genetic WNK-SPAK inhibition on NKCC1 and KCC3 expression and phosphorylation in vivo. Whole brain homogenates from WT and SPAK CCT L502A knock-in mice47 (SPAK502A/502A), engineered to mimic WNK-SPAK inhibition by STOCK1S-50699, were subjected to IP and/or IB with the indicated antibodies. Co-immunoprecipitation of KCC3 with SPAK was abrogated in SPAK502A/502A mice. (D) Bar graphs summarize ratios of phosphorylated target signal to total target intensity (mean+/− SD). *p < 0.05; **p < 0.01; ***p < 0.001. Similar to WNK3 KO mice, SPAK502A/502A mice exhibit apparently decreased KCC3 P-Thr1048 and NKCC1 P-Thr203/Thr207/Thr212 signals. (E) Co-immunoprecipitation experiments of WNK3, SPAK, and KCC3 in brain. Whole-brain lysates harvested from WT, KCC1/3 KO, and WNK3 KO mice were immunoprecipitated with the indicated WNK3, SPAK, and KCC3 antibodies, fractionated by SDS-PAGE, and subjected to Western blot analysis with the indicated antibodies. Results are representative of 3 independent experiments. WNK3-SPAK-KCC3 forms a physical complex in mammalian brain. (F) Effect of WNK3 KO on the cell volume of peri-infarct reactive astrocytes after MCAO. Representative immunofluorescent images are shown of WNK3 WT (arrows) and WNK3 KO brains (arrowheads) 72 h after MCAO. The soma volume of glial fibrillary acidic protein (GFAP)-positive astrocytes was measured in z-stacks using Imaris software (Version 8.2, Bitplane, Zurich, Switzerland) as described in Methods. Relative to WNK3 WT mice, reactive astrocytes from WNK3 KO mice exhibit significantly reduced cytotoxic edema after MCAO. Values are expressed as Mean ± SEM, n = 3; *p < 0.05 compared to WT. (G) Effect of WNK3 KO on blood-brain-barrier (BBB) integrity after MCAO. Representative immunofluorescent images are shown of infiltrated IgG in the brain parenchyma of WNK3 WT and WNK3 KO mice 72 h after MCAO. Bar graph summarizes the results of IgG infiltration. Relative to WNK3 WT mice, WNK3 KO mice exhibit decreased intraparenchymal infiltration IgG after MCAO, indicating less BBB breakdown. Values are expressed as mean ± SEM (n = 5), *p < 0.05 compared to WT.

