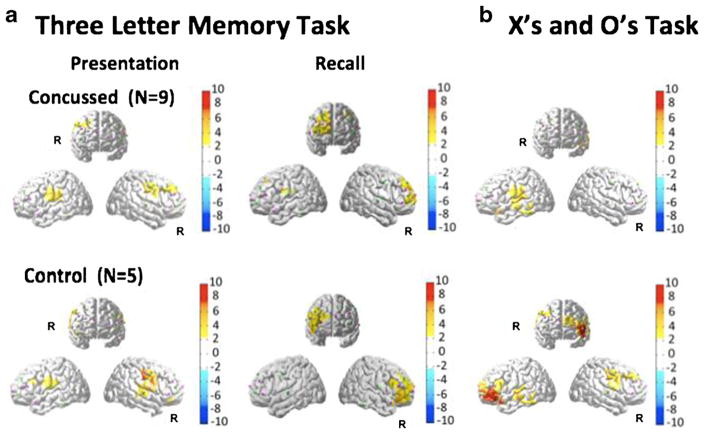
Fig. 5.
FNIRS activation maps (oxy-hemoglobin effect size; T-score) were reconstructed for the presentation and recall parts of the Three-Letters Memory module of the neurocognitive test (panel a). The activation maps for the X’s and O’s task is shown in panel b. The color maps indicate the effect size. Only significant areas (p<0.05; corrected) are shown

