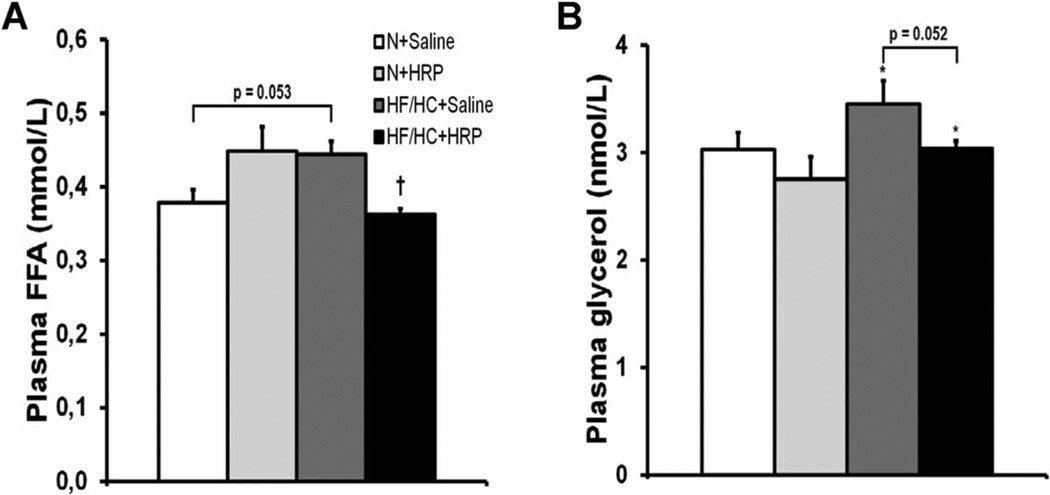
Figure 2.
HRP treatment decreased plasma FFA levels in obese mice. Plasma (A) FFA and (B) glycerol levels. Data are presented as mean ± SE with n = 7–9 per group for plasma FFA and n = 12–15 per group for plasma glycerol. *P < 0.05 compared with N diet; †P < 0.05 compared with saline. FFA, free fatty acid; HF/HC, high-fat/high-carbohydrate diet; HRP, handle region peptide; N, normal.

