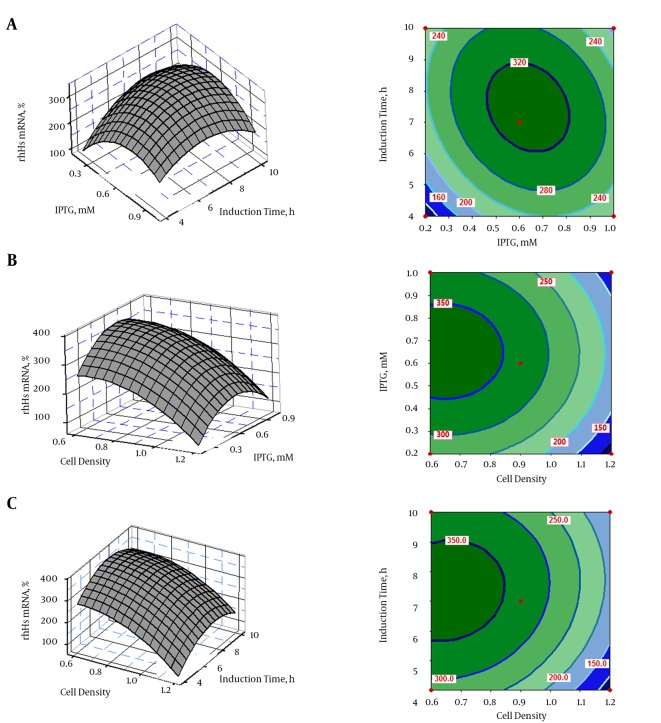
Figure 3. Response Surface Plots (left) and Contour Plots (right) of rhES mRNA Revealed the Relationship Between the Response and Actual Levels of Each Independent Variable.
A, The effect of inducer concentration (IPTG) and post-induction time on rhES mRNA; B, the effect of inducer concentration (IPTG) and cell density before induction time on rhES mRNA; C, the effect of post-induction time and cell density before induction time on rhES mRNA.

