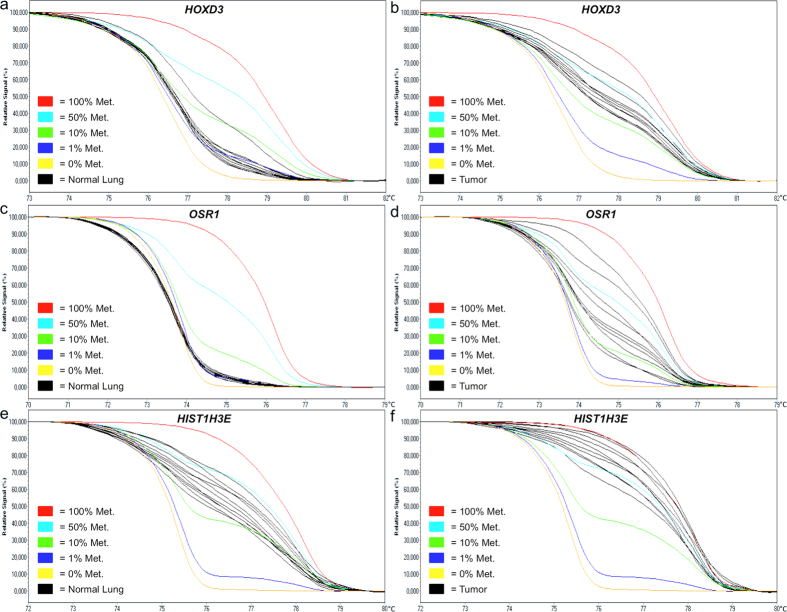
Figure 2. Examples of melting profiles observed for the HOXD3, OSR1 and HIST1H3E regions.
The methylation level of the 18 DMRs was determined using MS-HRM analysis. Representative normalized melting profiles for 10 tumor-adjacent normal lung samples and 10 LAC tumors are shown in black in (a,b) for HOXD3, (c,d) for OSR1 and in (e,f) for HIST1H3E. The DNA methylation standards were generated as a serial dilution of fully methylated DNA into an unmethylated background. The 100% methylated standard is shown in red, 50% methylated standard in light blue, 10% methylated standard in green, 1% methylated standard in dark blue and the 0% methylated standard in yellow.

