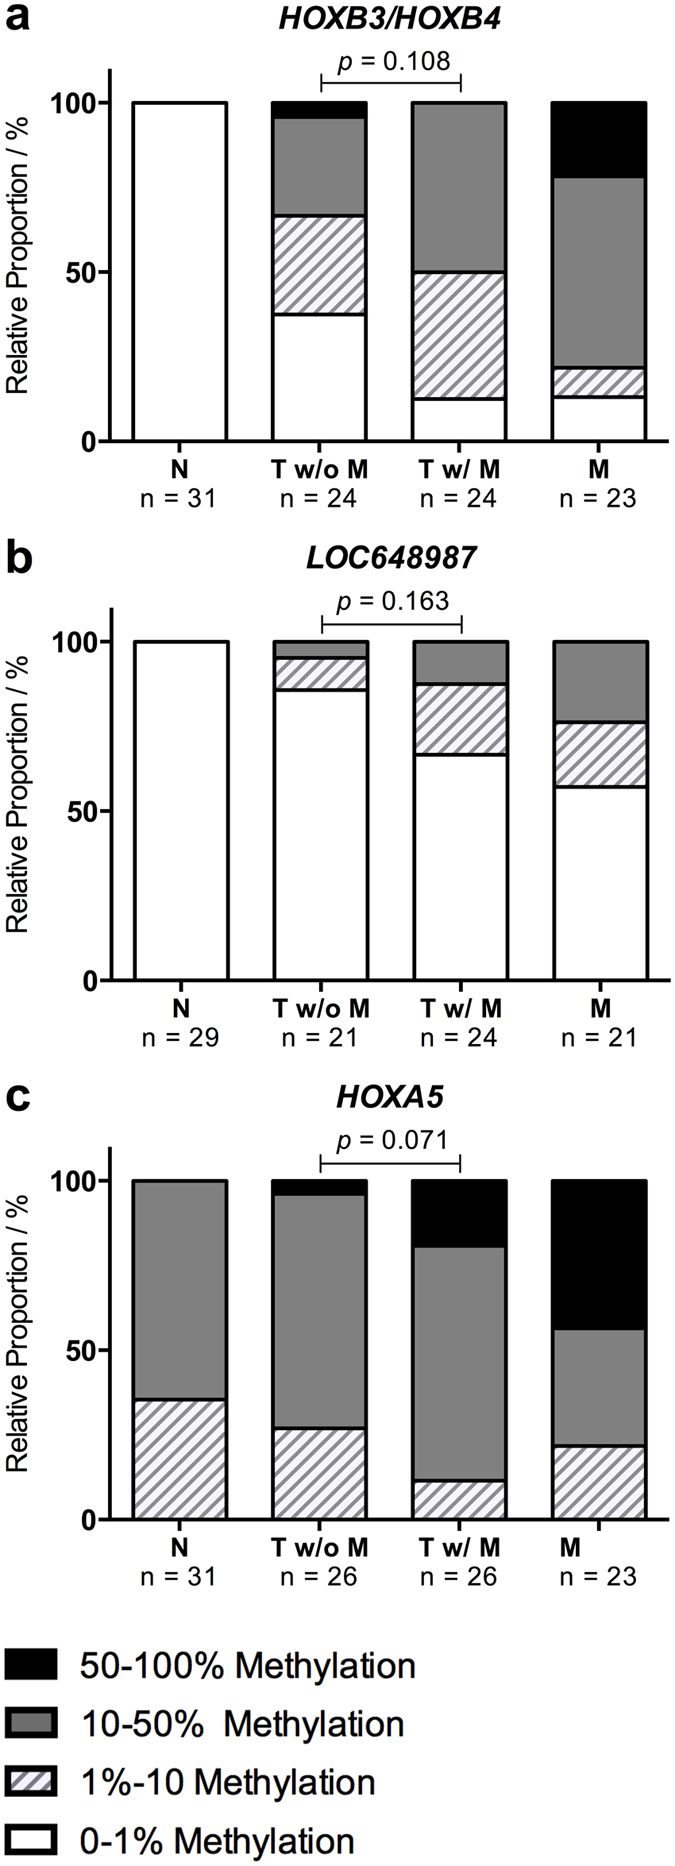
Figure 3. Methylation levels in metastasizing and non-metastasizing LAC tumors.

The methylation levels of the 18 DMRs were compared between 26 metastasizing and 26 non-metastasizing LAC primary tumors. Three regions demonstrated a tendency towards increased methylation in the metastasizing tumors and a similar increase was observed in the 24 paired metastases (20 brain and 4 adrenal gland). The results are shown as stacked bar percentage plots in (a) for HOXB3/HOXB4, (b) for LOC648987 and in (c) for HOXA5. The relative proportion of samples in each category with 0–1% methylated templates are shown in white, 1–10% methylated templates in white with light grey stripes, 10–50% methylated templates in dark grey and 50–100% methylated templates in black. The statistical significance of the detected differences in methylation between groups was assessed using a Mann-Whitney test of ranks and two-tailed p-values ≤ 0.05 were considered statistically significant.
