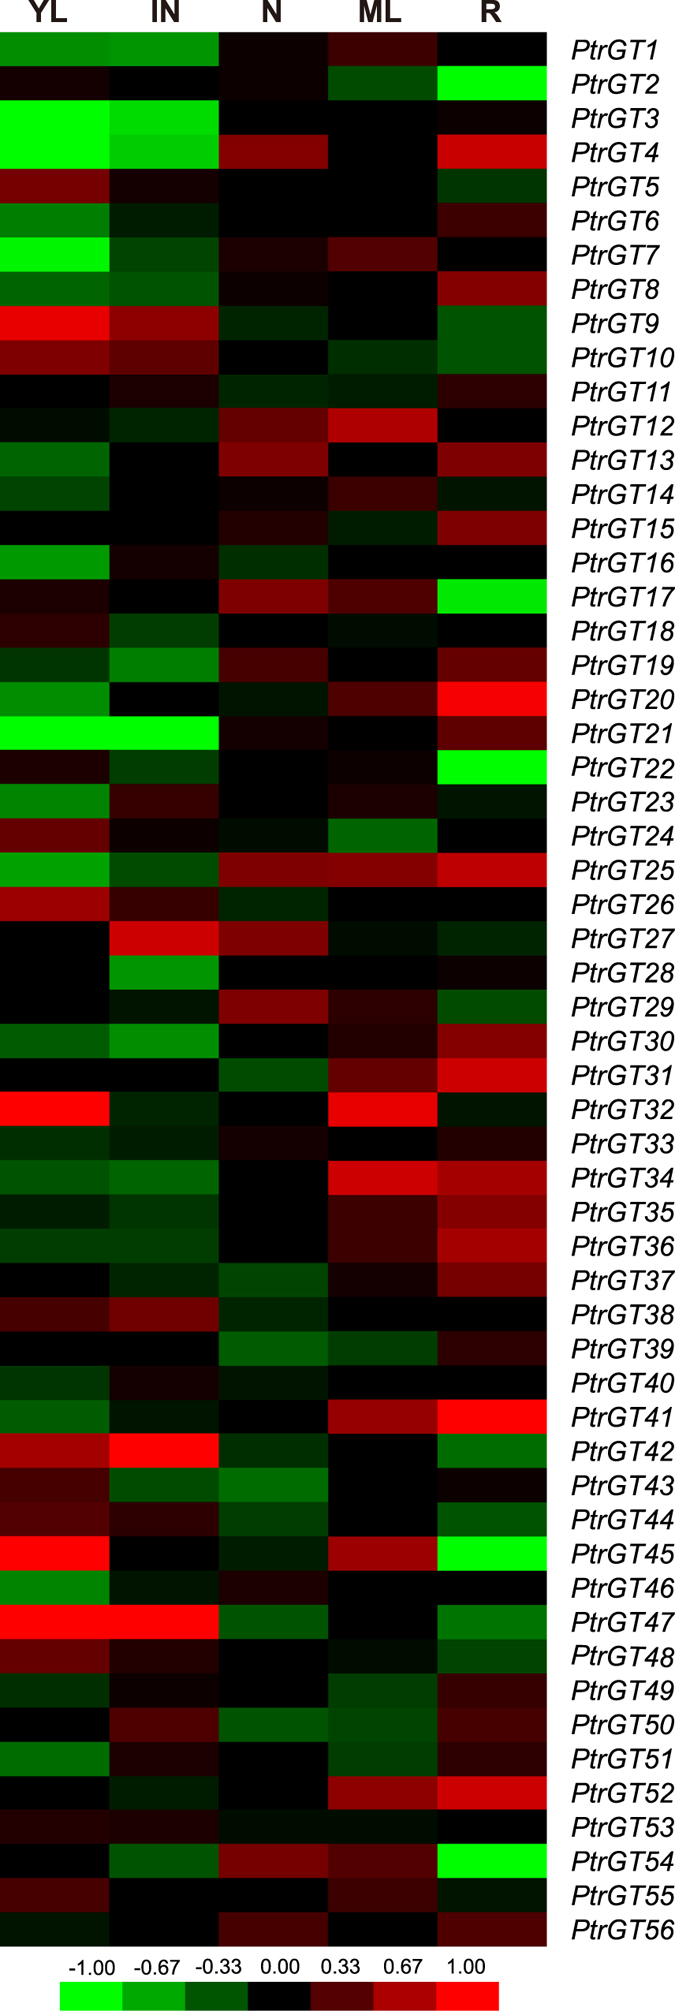
Figure 5. ExImage analysis of Populus trihelix genes in different tissues.

YL, IN, N, ML and R refer to young leaves, internodes, nodes, mature leaves and roots, respectively. The exImage was visualized by the exImage tool in the PopGenIE v3.0 database. Red and green indicate high and low levels of transcript abundances, respectively.
