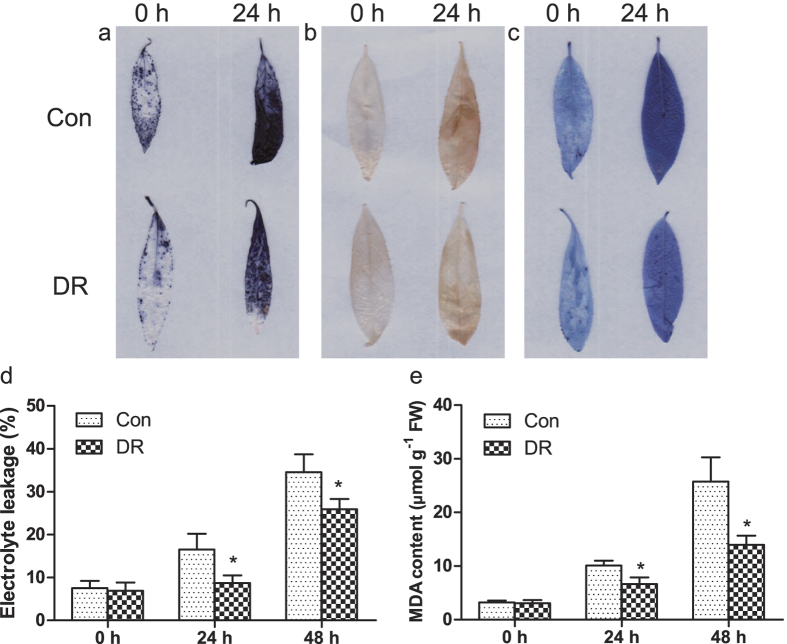
Figure 9. Histochemical staining and related physiological changes analyses of transformed P. ussuriensis plants.
(a,b) The plants were stained with NBT (a) and DAB (b) to reveal the accumulation of O2− and H2O2, respectively. (c) Analysis of cell death by Evans Blue staining. (d) Analysis of electrolyte leakage rate. (e) Analysis of MDA level. The asterisks indicate statistically significant differences between the relative expression of control and DR plants (*P < 0.05).

