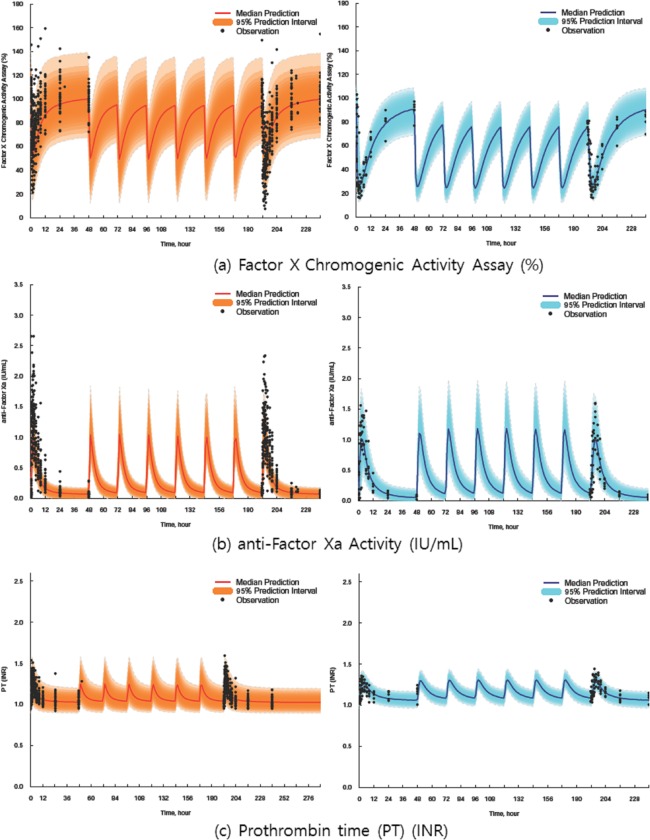
Figure 3.

Representative model prediction vs. observation plots for pharmacodynamic models of anti‐Factor Xa activity (%), coagulation factor X (%), prothrombin time (international normalized ratio (INR)) (left column, GCC‐4401C; right column, rivaroxaban) on single and multiple oral administration of GCC‐4401C at 40 mg and rivaroxaban at 20 mg. The shaded area represents the 95% prediction interval, and the solid red line represents the median prediction. Plots are standardized ones to dose at 40 mg (prediction‐corrected visual predictive check).
