
Figure 1.
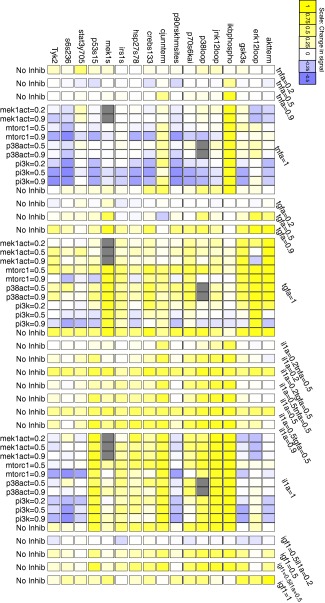
Initial dose–response dataset. We measured phospho‐protein levels in response to cotreatments consisting of different doses of small‐molecule inhibitors and cytokine/growth factor stimulation (see Supplementary Tables 1, 2, for abbreviation definitions). The cytokines and growth factors and their relative doses (0 = absent, 1 = maximum dose) are listed along the right side of the plot, while the inhibitors and their relative doses are listed along the left side of the plot. The phospho‐proteins are listed along the top of the plot (see Supplementary Table 3 for abbreviation definitions). The box colors indicate the phospho‐protein levels relative to those observed in vehicle‐treated cells. For each signaling protein, the normalized data represent the relative fold change of signal poststimulation compared to its basal value. Relative fold change has been scaled such that the maximum for each signal is one49; The yellow and purple colors scale with the magnitude of increase or decrease, respectively. The gray boxes denote phospho‐proteins whose kinase activities were inhibited by the inhibitor, such that their phospho‐levels did not correspond to their kinase activities.