
Figure 2.
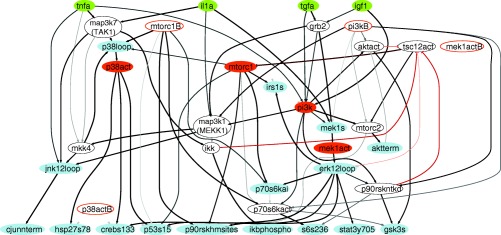
Ensemble of trained CFL models. The prior knowledge network shown in Supplementary Figure 3 was trained to the data from Figure 1. Green nodes denote stimulatory cytokines or growth factors, blue nodes indicate measured phospho‐proteins, orange nodes denote inhibited kinases, and white nodes denote nonmeasured or nonperturbed proteins whose inclusion in the models is necessary for logical consistency. Gray/black edges denote activation while orange‐red edges denote inhibition. The relative thickness and darkness of the edges are proportional to the number of models of the ensemble in which the edge is included.