
Figure 4.
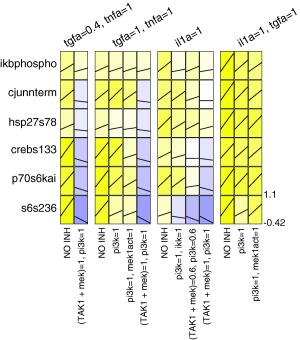
Dataset for model validation. We performed independent experiments to generate data against which the model predictions were compared. The plot layout is similar to that of Figure 1 except the relative changes compared to unstimulated value were additionally shown using black lines. The color map is the same as that used in Figure 1. Note that while we intended to test TAK1 inhibition in isolation, the inhibitor compound features off‐target activity towards MEK. Thus, conditions featuring this inhibitor are denoted by (TAK1 + MEK).