
Figure 5.
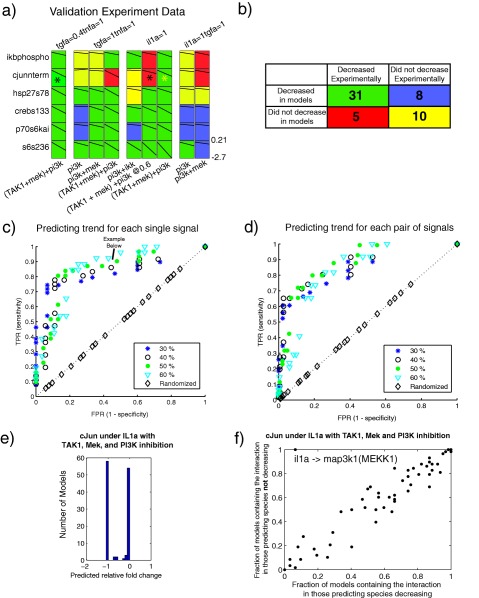
Experimental validation of Q2LM predictions. (a) Fold changes of inhibition for the experimental data. For the case in which the thresholds were defined as the average model value decreasing by 50% and average experimental value decreasing by 40%, the boxes are colored green if a decrease was both predicted and observed (true positive) or yellow if a decrease was not predicted and not observed (true negative). If the prediction and data did not match, the boxes were colored red (false negative) or purple (false positive). The species marked with an asterisk were predicted to decrease in some models but remained the same in others, resulting in a distribution of (ambivalent) predictions. (b) A summary of true positives, false positives, true negatives, and false negatives from panel a. This contingency table is statistically significant (P = 0.0028 by two‐sided Fisher exact test), with a true‐positive rate of 86% and false‐positive rate of 44%. (c,d) Receiver‐operating characteristic (ROC) curves for different percentage decreases of the levels of single (c) and pairs of (d) phospho‐proteins. Each point color/shape indicates a different experimental data threshold to consider a phospho‐signal as “decreased.” The true‐positive rate (TPR, or sensitivity) indicates that the model accurately predicted that the phospho‐protein levels decreased below the indicated percentage, whereas the false‐positive rate (FPR, 1‐specificity) denotes that the model accurately predicted cases for which the levels did not drop below the indicated percentage. (e) Bimodal predictions of phospho‐cJun levels in response to IL‐1α and TAK1, PI3K, and MEK inhibition. (f) Topological basis of the ambivalent cJun predictions. We divided the models into two sets: those that predicted cJun phosphorylation would decrease and those that did not. We then plotted the fraction of models containing each interaction in the processed PKN for each set. We observed one outlying data point (top lefthand corner between il1a and map3k1).