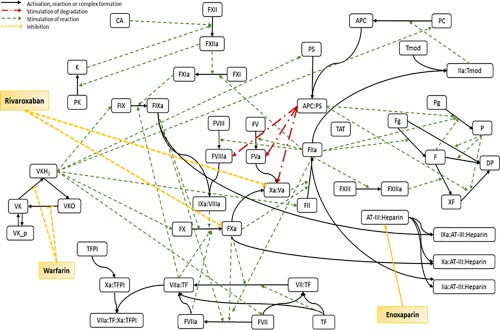
Figure 2.

Scheme of the human coagulation network model. Solid black lines represent activation processes, complex formation, reduction, or oxidation. Broken red lines represent stimulation of degradation. Broken green lines represent stimulation of reaction. Broken yellow lines represent inhibition of reaction. APC, activated protein C; CA, activator of contact system; D, degradation product; F, fibrin; Fg, fibrinogen; FII, prothrombin; FIIa, thrombin; K, kallikrein; P, plasmin; PC, protein C; PS, protein S; Pg, plasminogen; TAT, thrombin‐antithrombin‐complex; TF, tissue factor; TFPI, tissue factor pathway inhibitor; Tmod, thrombomodulin; VK, vitamin K; VKH2, vitamin K hydroquinone; VKO, vitamin K epoxide; XF, cross‐linked fibrin.
