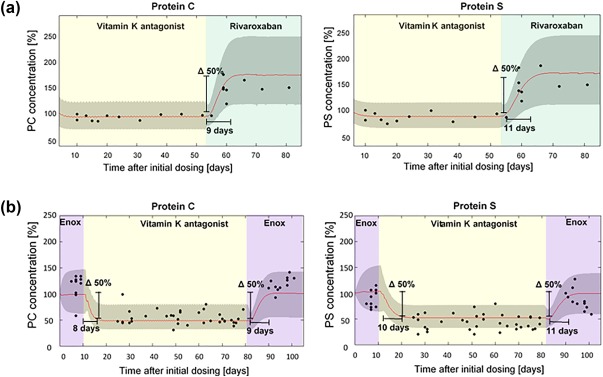
Figure 5.

Monte Carlo simulations of protein C (PC) and protein S (PS) under therapy switch from (a) steady‐state vitamin K antagonist (VKA; warfarin/phenprocoumon; 5 mg p.o. once‐daily) to steady‐state rivaroxaban (20 mg p.o. once‐daily) treatment, and (b) steady‐state enoxaparin (60 mg s.c., once‐daily) to steady‐state VKA (5 mg p.o, once‐daily) to steady‐state enoxaparin (60 mg s.c., once‐daily; red line: median, lower, and upper bounds of the gray‐shaded area: 5th and 95th percentiles, respectively). Simulations are overlaid with the observed individual patient coagulation factor level concentrations (black dots). The gray‐shaded area stems from the 20% variability added to the estimated production rates of FII, FV, FVII, FIX, FX, FXI, FXII, FXIII, PC, and PS in order to account for interindividual variability. Factor concentrations are expressed as percent of the initial concentration obtained from literature assumed to represent physiological values.
